29
/
en
AIzaSyAYiBZKx7MnpbEhh9jyipgxe19OcubqV5w
April 1, 2024
91062
Brazil
BRA
true
2
1
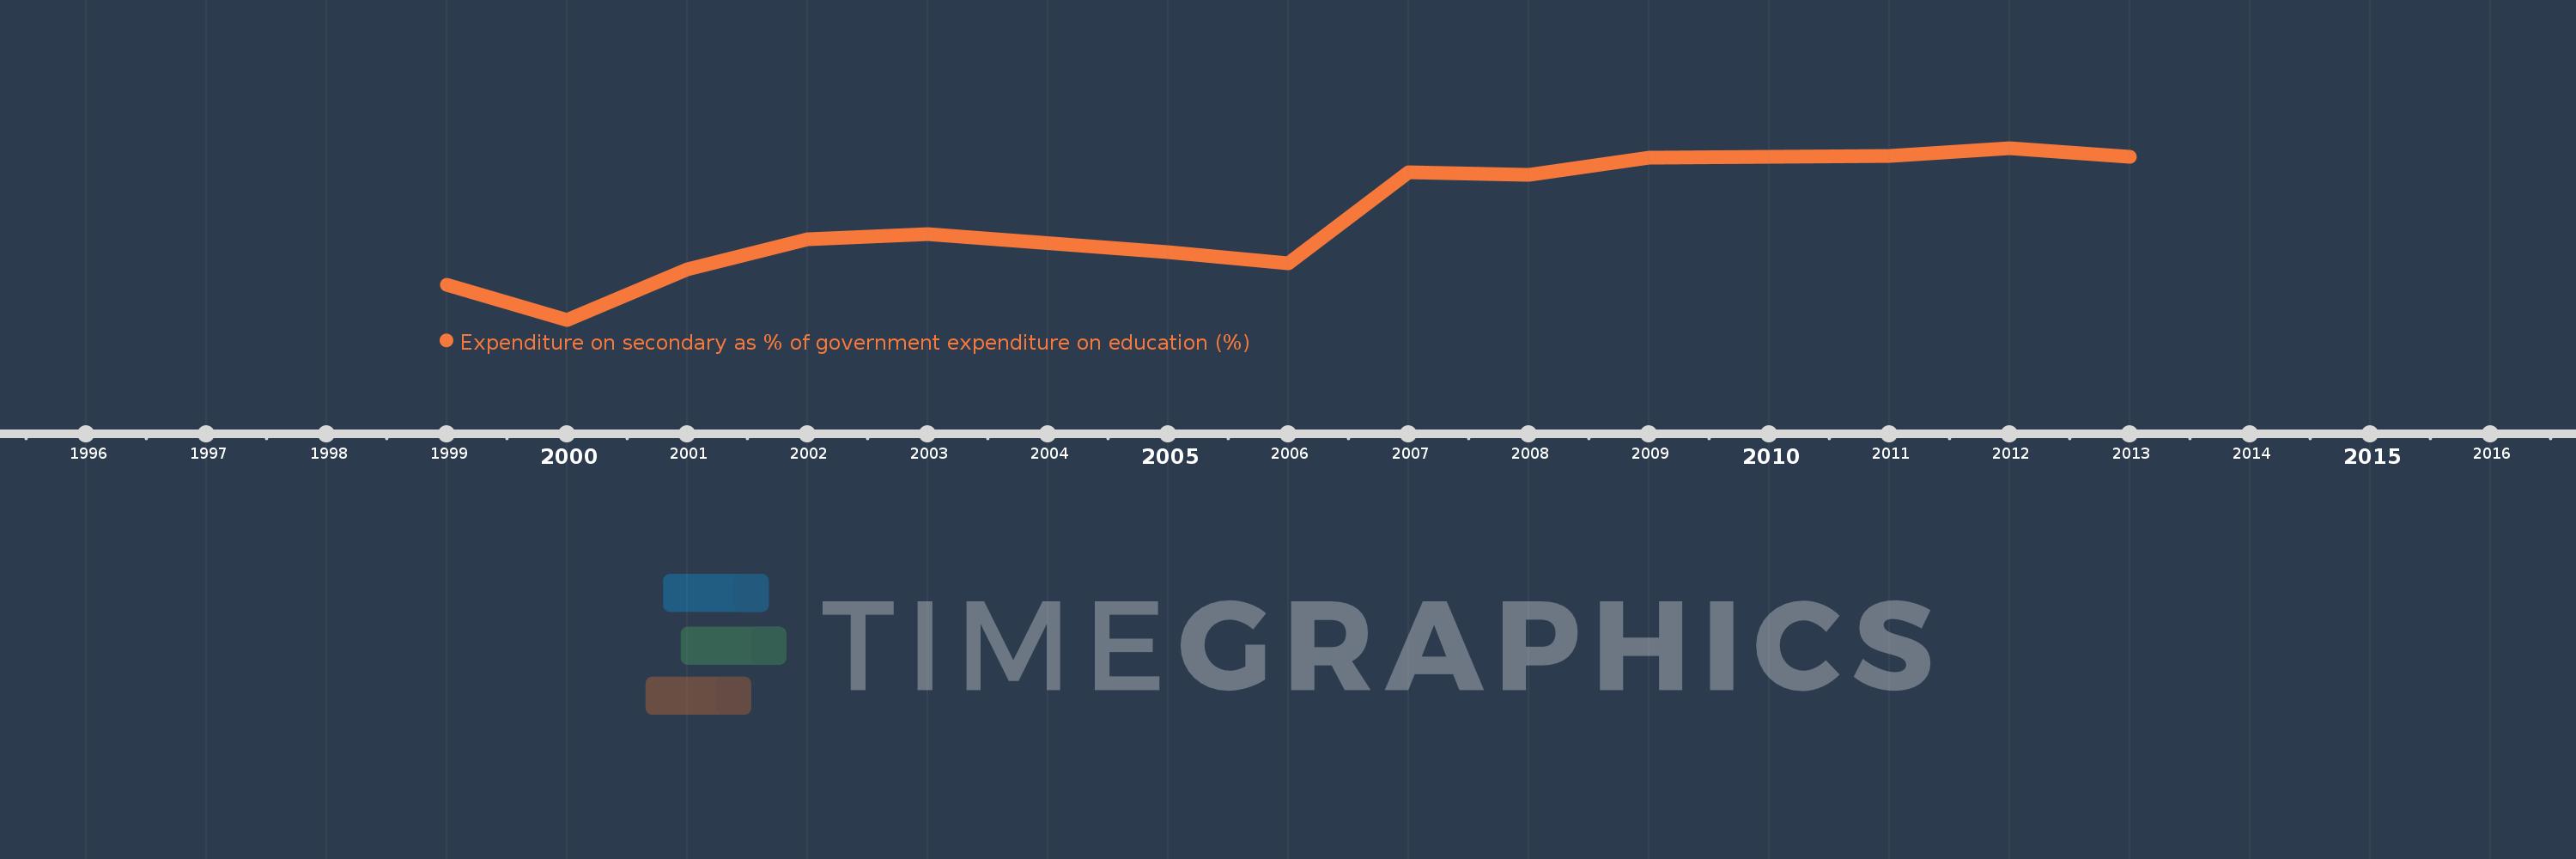
Expenditure on secondary as % of government expenditure on education (%)
2013,2012,2011,2010,2009,2008,2007,2006,2005,2003,2002,2001,2000,1999
This statistics in other country:
Timeline:
This timeline shows a graph from 1999 to 2013 of Brazil. No data until 1998. Number of actual observations by date: 14.
Source name:
World Development Indicators
Source organization:
UNESCO Institute for Statistics
Categories, topics:
Education
Last updated:
apr 23, 2017
Indicators value changes by year
Minimum:
35.657
jan 1, 2000
Maximum:
45.118
jan 1, 2012
At the date of observation
Value
Absolute change
Change from previous value
jan 1, 1999
37.597
+37.597
0.0%
jan 1, 2000
35.657
-1.939
-5.16%
jan 1, 2001
38.442
+2.785
7.81%
jan 1, 2002
40.081
+1.638
4.26%
jan 1, 2003
40.363
+0.283
0.71%
jan 1, 2005
39.363
-1.0
-2.48%
jan 1, 2006
38.788
-0.575
-1.46%
jan 1, 2007
43.788
+5.0
12.89%
jan 1, 2008
43.656
-0.132
-0.3%
jan 1, 2009
44.564
+0.909
2.08%
jan 1, 2010
44.608
+0.044
0.1%
jan 1, 2011
44.665
+0.056
0.13%
jan 1, 2012
45.118
+0.453
1.01%
jan 1, 2013
44.619
-0.499
-1.11%
Ranking of countries by current statistics by years


Comments: