29
/
en
AIzaSyAYiBZKx7MnpbEhh9jyipgxe19OcubqV5w
April 1, 2024
69731
Argentina
ARG
true
2
1
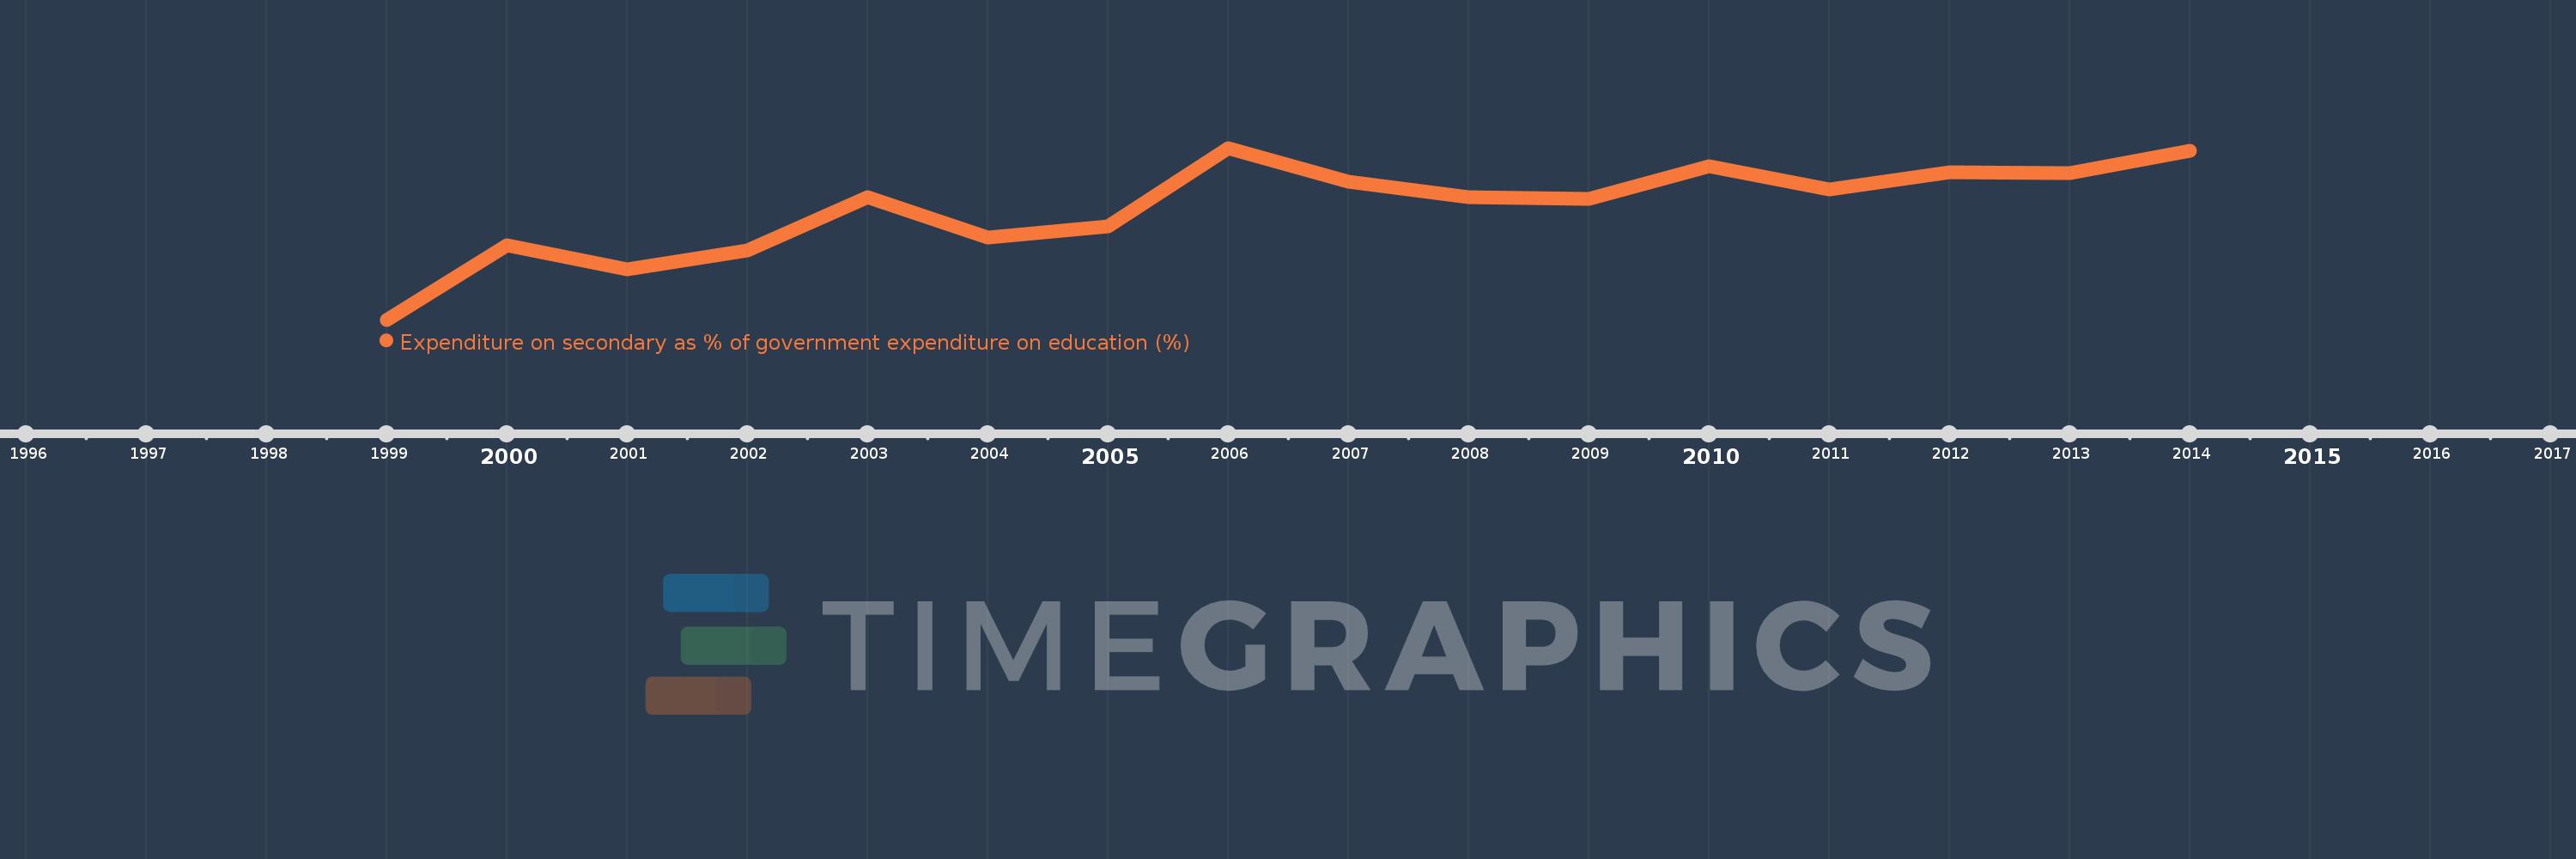
Expenditure on secondary as % of government expenditure on education (%)
2014,2013,2012,2011,2010,2009,2008,2007,2006,2005,2004,2003,2002,2001,2000,1999
This statistics in other country:
Timeline:
This timeline shows a graph from 1999 to 2014 of Argentina. No data until 1998. Number of actual observations by date: 16.
Source name:
World Development Indicators
Source organization:
UNESCO Institute for Statistics
Categories, topics:
Education
Last updated:
apr 23, 2017
Indicators value changes by year
Minimum:
33.212
jan 1, 1999
Maximum:
41.687
jan 1, 2006
At the date of observation
Value
Absolute change
Change from previous value
jan 1, 1999
33.212
+33.212
0.0%
jan 1, 2000
36.907
+3.694
11.12%
jan 1, 2001
35.703
-1.204
-3.26%
jan 1, 2002
36.625
+0.922
2.58%
jan 1, 2003
39.242
+2.616
7.14%
jan 1, 2004
37.26
-1.982
-5.05%
jan 1, 2005
37.799
+0.539
1.45%
jan 1, 2006
41.687
+3.888
10.29%
jan 1, 2007
40.021
-1.666
-4.0%
jan 1, 2008
39.246
-0.776
-1.94%
jan 1, 2009
39.194
-0.052
-0.13%
jan 1, 2010
40.773
+1.579
4.03%
jan 1, 2011
39.65
-1.123
-2.75%
jan 1, 2012
40.472
+0.822
2.07%
jan 1, 2013
40.438
-0.033
-0.08%
jan 1, 2014
41.527
+1.089
2.69%
Ranking of countries by current statistics by years


Comments: