29
/
en
AIzaSyAYiBZKx7MnpbEhh9jyipgxe19OcubqV5w
April 1, 2024
155904
Indonesia
IDN
true
2
1
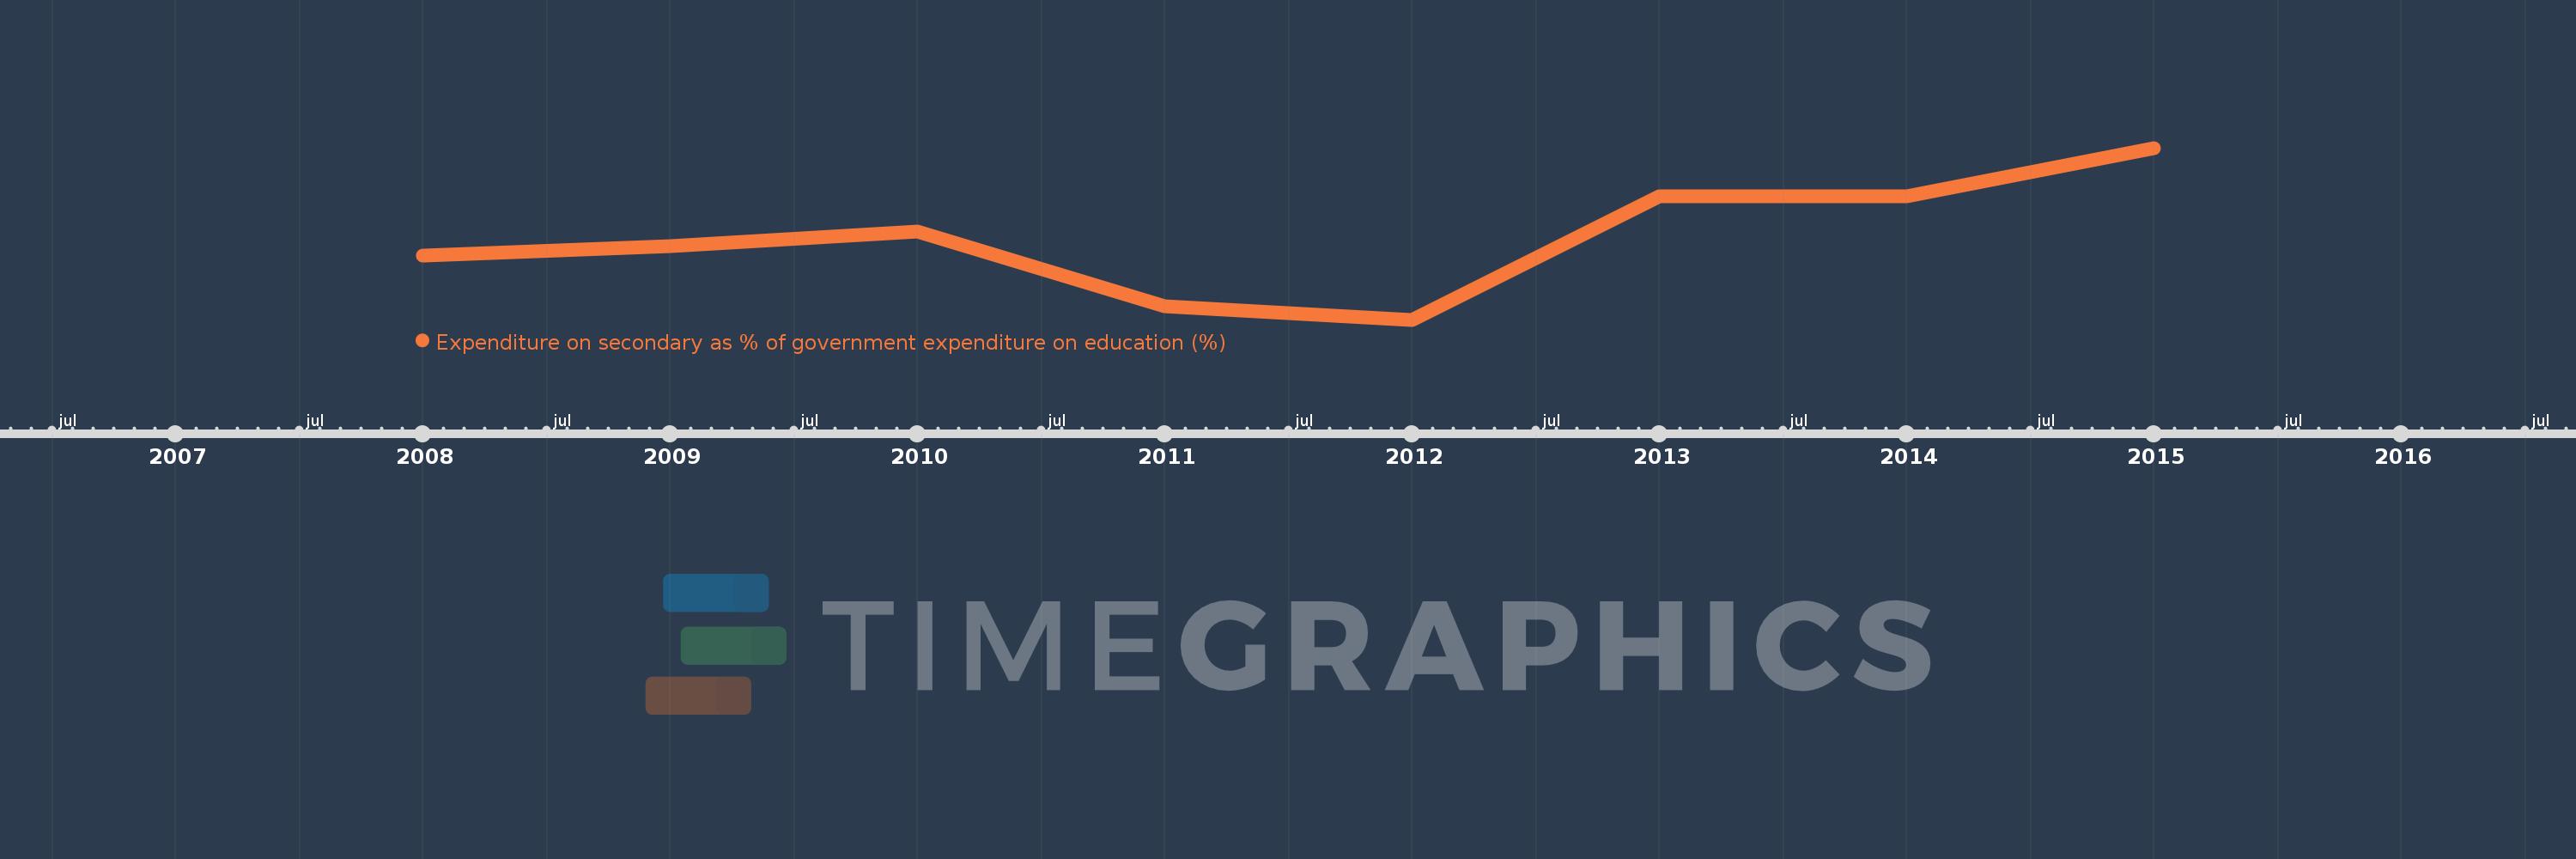
Expenditure on secondary as % of government expenditure on education (%)
2015,2014,2013,2012,2011,2010,2009,2008
This statistics in other country:
Timeline:
This timeline shows a graph from 2008 to 2015 of Indonesia. No data until 2007. Number of actual observations by date: 8.
Source name:
World Development Indicators
Source organization:
UNESCO Institute for Statistics
Categories, topics:
Education
Last updated:
apr 23, 2017
Indicators value changes by year
Minimum:
24.108
jan 1, 2012
Maximum:
26.799
jan 1, 2015
At the date of observation
Value
Absolute change
Change from previous value
jan 1, 2008
25.107
+25.107
0.0%
jan 1, 2009
25.26
+0.152
0.61%
jan 1, 2010
25.496
+0.237
0.94%
jan 1, 2011
24.321
-1.176
-4.61%
jan 1, 2012
24.108
-0.213
-0.88%
jan 1, 2013
26.038
+1.93
8.01%
jan 1, 2014
26.035
-0.002
-0.01%
jan 1, 2015
26.799
+0.764
2.93%
Ranking of countries by current statistics by years


Comments: