29
/
en
AIzaSyAYiBZKx7MnpbEhh9jyipgxe19OcubqV5w
April 1, 2024
186432
Malawi
MWI
true
2
1
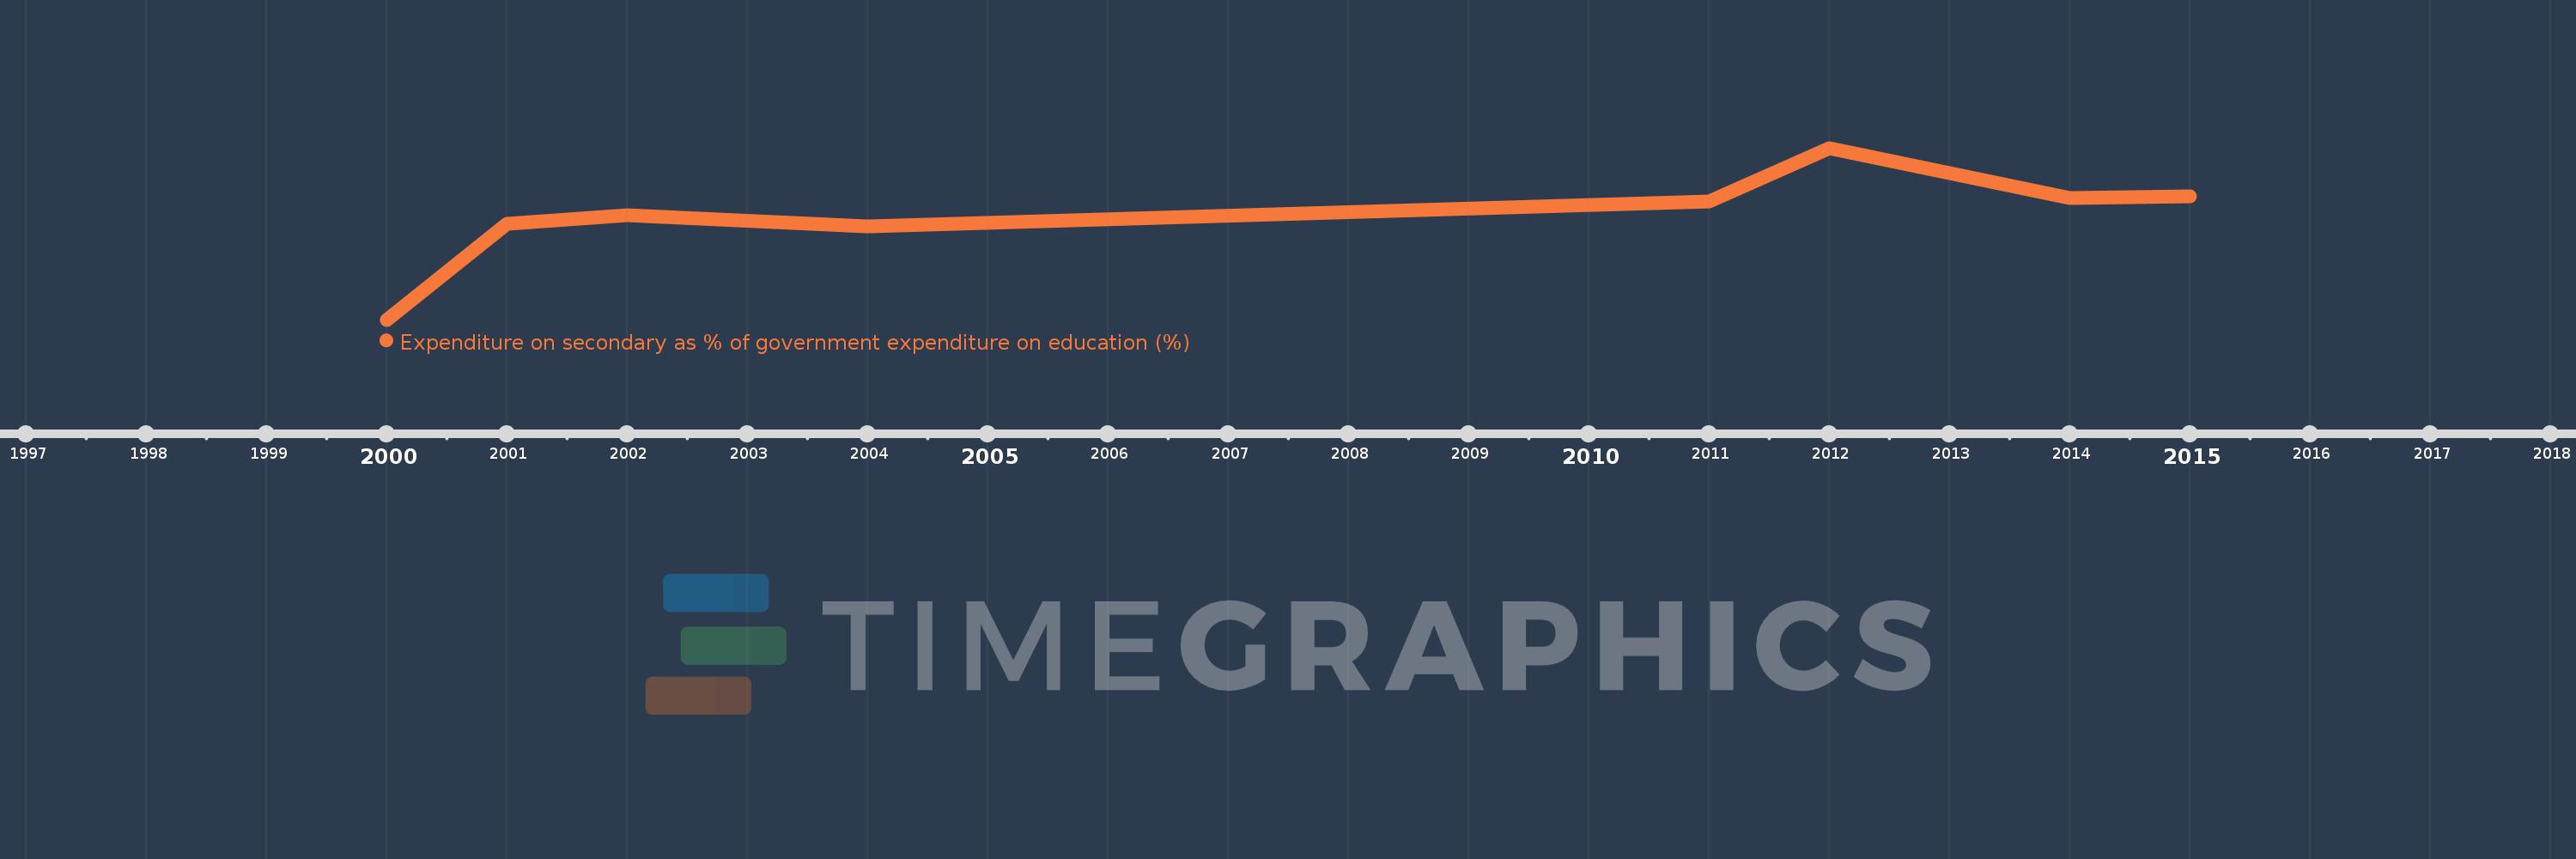
Expenditure on secondary as % of government expenditure on education (%)
2015,2014,2012,2011,2004,2002,2001,2000
This statistics in other country:
Timeline:
This timeline shows a graph from 2000 to 2015 of Malawi. No data until 1999. Number of actual observations by date: 8.
Source name:
World Development Indicators
Source organization:
UNESCO Institute for Statistics
Categories, topics:
Education
Last updated:
apr 23, 2017
Indicators value changes by year
Minimum:
10.085
jan 1, 2000
Maximum:
30.402
jan 1, 2012
At the date of observation
Value
Absolute change
Change from previous value
jan 1, 2000
10.085
+10.085
0.0%
jan 1, 2001
21.441
+11.356
112.61%
jan 1, 2002
22.495
+1.054
4.92%
jan 1, 2004
21.106
-1.389
-6.17%
jan 1, 2011
24.09
+2.984
14.14%
jan 1, 2012
30.402
+6.312
26.2%
jan 1, 2014
24.435
-5.967
-19.63%
jan 1, 2015
24.665
+0.23
0.94%
Ranking of countries by current statistics by years


Comments: