29
/
en
AIzaSyAYiBZKx7MnpbEhh9jyipgxe19OcubqV5w
April 1, 2024
93862
Bulgaria
BGR
true
2
1
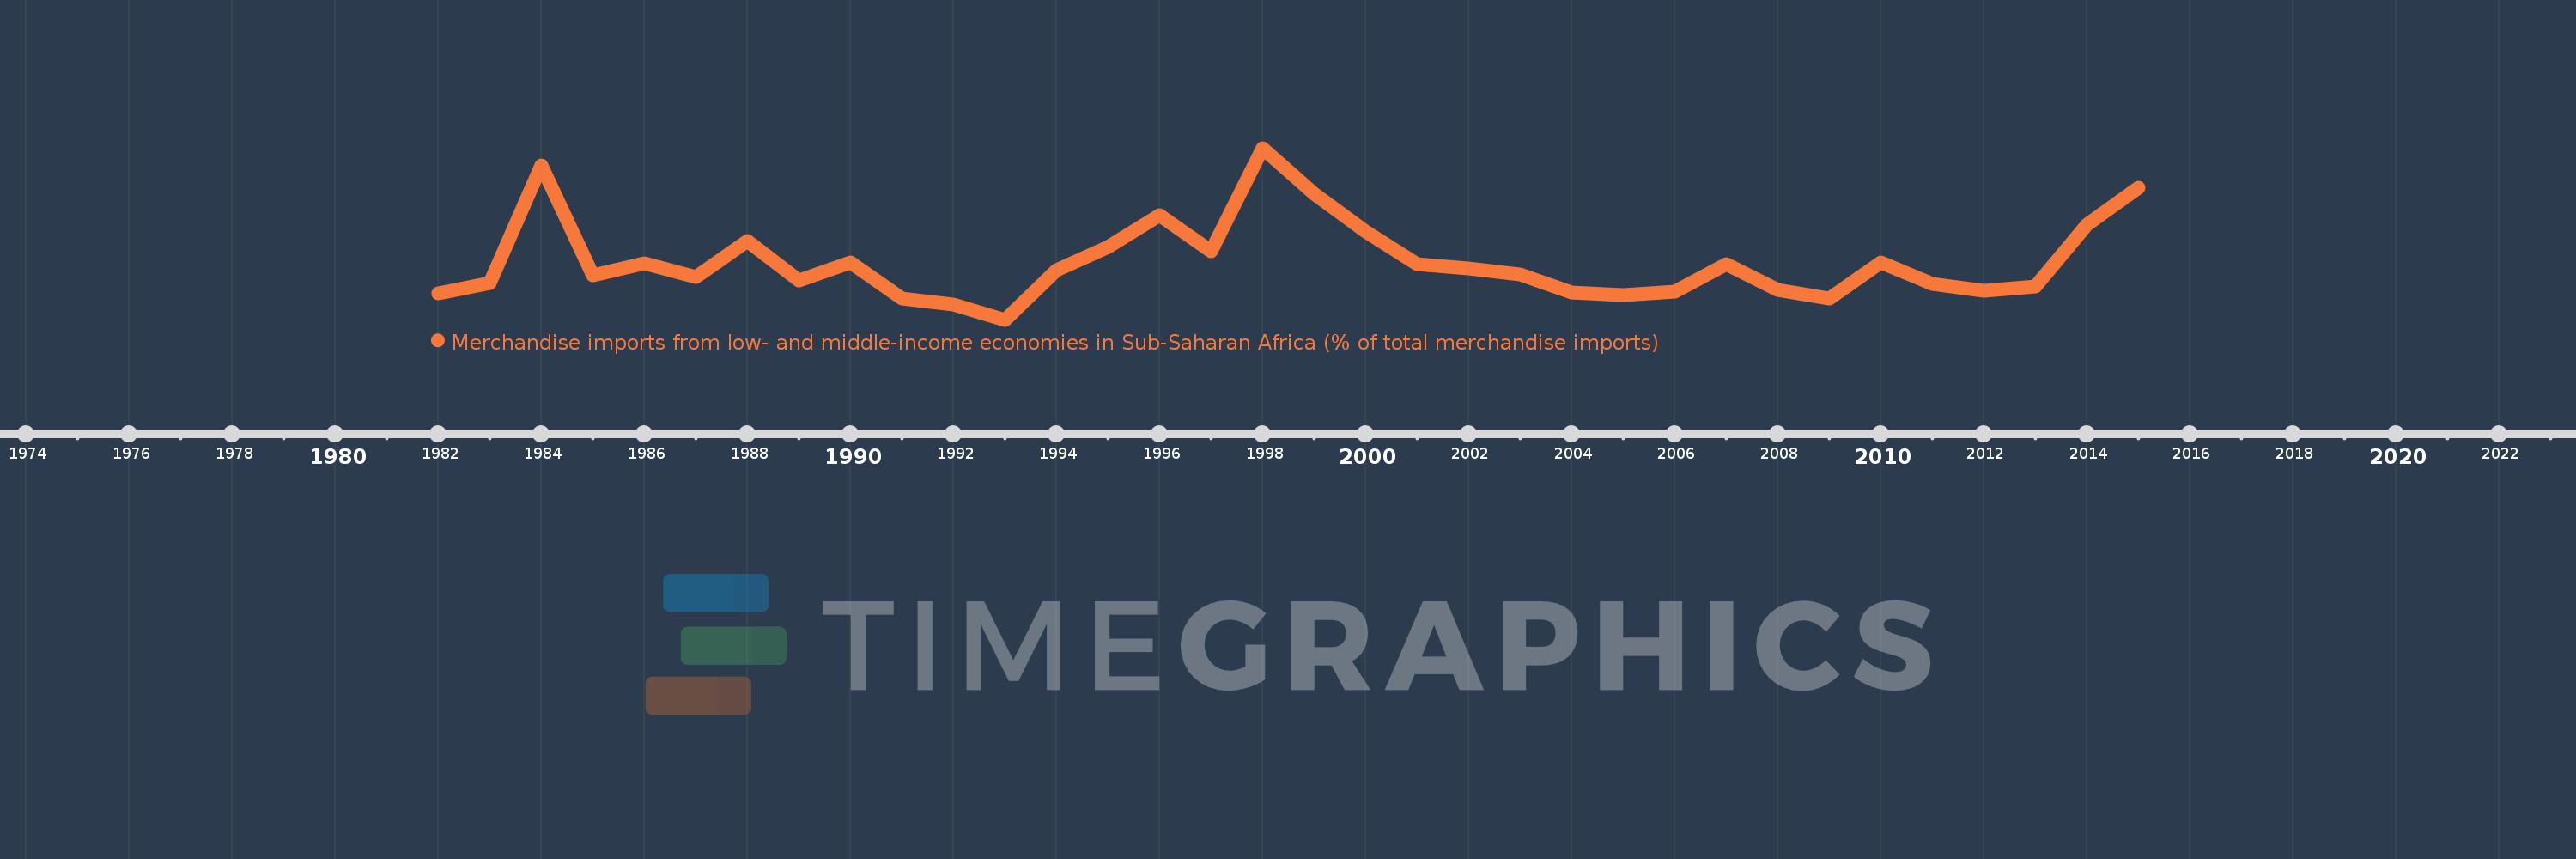
Merchandise imports from low- and middle-income economies in Sub-Saharan Africa (% of total merchandise imports)
2015,2014,2013,2012,2011,2010,2009,2008,2007,2006,2005,2004,2003,2002,2001,2000,1999,1998,1997,1996,1995,1994,1993,1992,1991,1990,1989,1988,1987,1986,1985,1984,1983,1982
This statistics in other country:
AlbaniaAlgeriaAngolaArab WorldArgentinaArmeniaArubaAustraliaAustriaAzerbaijanBahamas, TheBahrainBangladeshBarbadosBelarusBelgiumBelizeBeninBermudaBoliviaBrazilBrunei DarussalamBulgariaBurkina FasoBurundiCabo VerdeCambodiaCameroonCanadaCaribbean small statesCentral African RepublicCentral Europe and the BalticsChadChileChinaColombiaCongo, Dem. Rep.Congo, Rep.Costa RicaCote d'IvoireCroatiaCubaCyprusCzech RepublicDenmarkDjiboutiDominicaDominican RepublicEarly-demographic dividendEast Asia & PacificEast Asia & Pacific (excluding high income)East Asia & Pacific (IDA & IBRD countries)EcuadorEgypt, Arab Rep.El SalvadorEstoniaEthiopiaEuro areaEurope & Central AsiaEurope & Central Asia (excluding high income)Europe & Central Asia (IDA & IBRD countries)European UnionFijiFinlandFragile and conflict affected situationsFranceGabonGambia, TheGeorgiaGermanyGhanaGreeceGreenlandGrenadaGuatemalaGuineaGuinea-BissauGuyanaHaitiHeavily indebted poor countries (HIPC)High incomeHondurasHong Kong SAR, ChinaHungaryIBRD onlyIcelandIDA & IBRD totalIDA blendIDA onlyIDA totalIndiaIndonesiaIran, Islamic Rep.IraqIrelandIsraelItalyJamaicaJapanJordanKazakhstanKenyaKorea, Dem. People’s Rep.Korea, Rep.KuwaitLao PDRLate-demographic dividendLatin America & Caribbean Latin America & Caribbean (excluding high income)Latin America & the Caribbean (IDA & IBRD countries)LatviaLeast developed countries: UN classificationLebanonLiberiaLibyaLithuaniaLow & middle incomeLow incomeLower middle incomeLuxembourgMacao SAR, ChinaMacedonia, FYRMadagascarMalawiMalaysiaMaliMaltaMauritaniaMauritiusMexicoMiddle East & North AfricaMiddle East & North Africa (excluding high income)Middle East & North Africa (IDA & IBRD countries)Middle incomeMoldovaMontenegroMoroccoMozambiqueMyanmarNetherlandsNew CaledoniaNew ZealandNicaraguaNigerNigeriaNorth AmericaNorwayOECD membersOmanOther small statesPacific island small statesPakistanPanamaPapua New GuineaParaguayPeruPhilippinesPolandPortugalPost-demographic dividendPre-demographic dividendQatarRomaniaRussian FederationRwandaSaudi ArabiaSenegalSerbiaSeychellesSierra LeoneSingaporeSlovak RepublicSloveniaSmall statesSomaliaSouth AfricaSouth AsiaSouth Asia (IDA & IBRD)SpainSri LankaSt. LuciaSt. Vincent and the GrenadinesSub-Saharan Africa Sub-Saharan Africa (excluding high income)Sub-Saharan Africa (IDA & IBRD countries)SudanSurinameSwedenSwitzerlandSyrian Arab RepublicTanzaniaThailandTogoTrinidad and TobagoTunisiaTurkeyUgandaUkraineUnited Arab EmiratesUnited KingdomUnited StatesUpper middle incomeUruguayVenezuela, RBVietnamWorldYemen, Rep.ZambiaZimbabwe Timeline:
This timeline shows a graph from 1982 to 2015 of Bulgaria. No data until 1981. Number of actual observations by date: 34.
Source name:
World Development Indicators
Source organization:
World Bank staff estimates based data from International Monetary Fund's Direction of Trade database.
Categories, topics:
Private Sector, Trade
Last updated:
apr 23, 2017
Indicators value changes by year
At the date of observation
Value
Absolute change
Change from previous value
jan 1, 1982
0.162
+0.162
0.0%
jan 1, 1983
0.227
+0.064
39.62%
jan 1, 1984
0.948
+0.722
318.29%
jan 1, 1985
0.273
-0.676
-71.25%
jan 1, 1986
0.349
+0.077
28.09%
jan 1, 1987
0.263
-0.086
-24.56%
jan 1, 1988
0.484
+0.221
83.7%
jan 1, 1989
0.241
-0.243
-50.24%
jan 1, 1990
0.351
+0.11
45.63%
jan 1, 1991
0.131
-0.22
-62.67%
jan 1, 1992
0.094
-0.037
-28.13%
jan 1, 1993
0.0
-0.094
-100.0%
jan 1, 1994
0.306
+0.306
%
jan 1, 1995
0.45
+0.144
47.03%
jan 1, 1996
0.642
+0.192
42.68%
jan 1, 1997
0.419
-0.223
-34.75%
jan 1, 1998
1.058
+0.639
152.55%
jan 1, 1999
0.777
-0.28
-26.52%
jan 1, 2000
0.544
-0.233
-30.01%
jan 1, 2001
0.341
-0.202
-37.21%
jan 1, 2002
0.317
-0.024
-7.1%
jan 1, 2003
0.278
-0.039
-12.36%
jan 1, 2004
0.167
-0.111
-40.0%
jan 1, 2005
0.154
-0.013
-7.74%
jan 1, 2006
0.171
+0.017
10.79%
jan 1, 2007
0.34
+0.17
99.58%
jan 1, 2008
0.183
-0.157
-46.14%
jan 1, 2009
0.132
-0.051
-27.94%
jan 1, 2010
0.355
+0.223
168.89%
jan 1, 2011
0.22
-0.135
-38.06%
jan 1, 2012
0.18
-0.04
-17.99%
jan 1, 2013
0.203
+0.023
12.73%
jan 1, 2014
0.584
+0.38
187.1%
jan 1, 2015
0.815
+0.231
39.62%
Ranking of countries by current statistics by years


Comments: