29
/
en
AIzaSyAYiBZKx7MnpbEhh9jyipgxe19OcubqV5w
April 1, 2024
25098
Caribbean small states
CSS
false
2
1
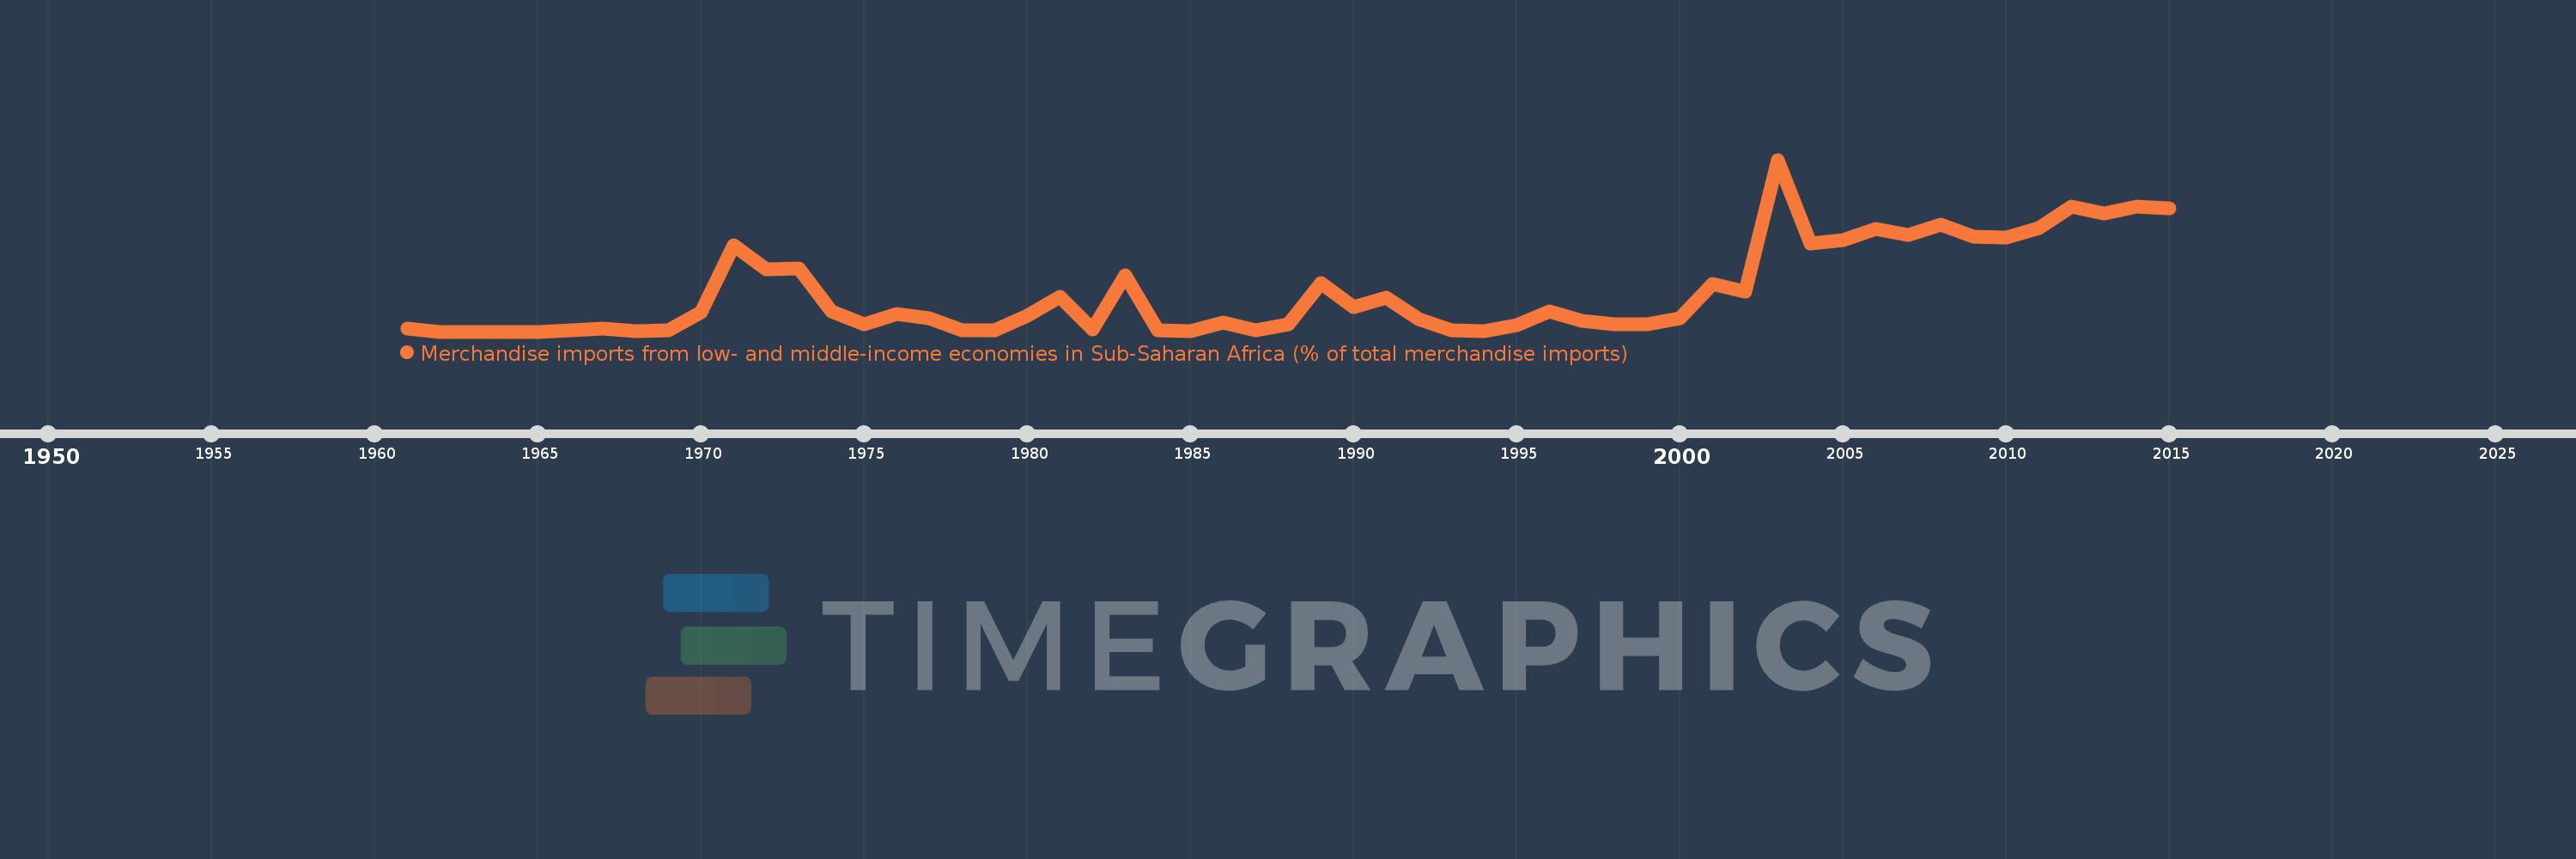
Merchandise imports from low- and middle-income economies in Sub-Saharan Africa (% of total merchandise imports)
2015,2014,2013,2012,2011,2010,2009,2008,2007,2006,2005,2004,2003,2002,2001,2000,1999,1998,1997,1996,1995,1994,1993,1992,1991,1990,1989,1988,1987,1986,1985,1984,1983,1982,1981,1980,1979,1978,1977,1976,1975,1974,1973,1972,1971,1970,1969,1968,1967,1966,1965,1964,1963,1962,1961
This statistics in other country:
AlbaniaAlgeriaAngolaArab WorldArgentinaArmeniaArubaAustraliaAustriaAzerbaijanBahamas, TheBahrainBangladeshBarbadosBelarusBelgiumBelizeBeninBermudaBoliviaBrazilBrunei DarussalamBulgariaBurkina FasoBurundiCabo VerdeCambodiaCameroonCanadaCaribbean small statesCentral African RepublicCentral Europe and the BalticsChadChileChinaColombiaCongo, Dem. Rep.Congo, Rep.Costa RicaCote d'IvoireCroatiaCubaCyprusCzech RepublicDenmarkDjiboutiDominicaDominican RepublicEarly-demographic dividendEast Asia & PacificEast Asia & Pacific (excluding high income)East Asia & Pacific (IDA & IBRD countries)EcuadorEgypt, Arab Rep.El SalvadorEstoniaEthiopiaEuro areaEurope & Central AsiaEurope & Central Asia (excluding high income)Europe & Central Asia (IDA & IBRD countries)European UnionFijiFinlandFragile and conflict affected situationsFranceGabonGambia, TheGeorgiaGermanyGhanaGreeceGreenlandGrenadaGuatemalaGuineaGuinea-BissauGuyanaHaitiHeavily indebted poor countries (HIPC)High incomeHondurasHong Kong SAR, ChinaHungaryIBRD onlyIcelandIDA & IBRD totalIDA blendIDA onlyIDA totalIndiaIndonesiaIran, Islamic Rep.IraqIrelandIsraelItalyJamaicaJapanJordanKazakhstanKenyaKorea, Dem. People’s Rep.Korea, Rep.KuwaitLao PDRLate-demographic dividendLatin America & Caribbean Latin America & Caribbean (excluding high income)Latin America & the Caribbean (IDA & IBRD countries)LatviaLeast developed countries: UN classificationLebanonLiberiaLibyaLithuaniaLow & middle incomeLow incomeLower middle incomeLuxembourgMacao SAR, ChinaMacedonia, FYRMadagascarMalawiMalaysiaMaliMaltaMauritaniaMauritiusMexicoMiddle East & North AfricaMiddle East & North Africa (excluding high income)Middle East & North Africa (IDA & IBRD countries)Middle incomeMoldovaMontenegroMoroccoMozambiqueMyanmarNetherlandsNew CaledoniaNew ZealandNicaraguaNigerNigeriaNorth AmericaNorwayOECD membersOmanOther small statesPacific island small statesPakistanPanamaPapua New GuineaParaguayPeruPhilippinesPolandPortugalPost-demographic dividendPre-demographic dividendQatarRomaniaRussian FederationRwandaSaudi ArabiaSenegalSerbiaSeychellesSierra LeoneSingaporeSlovak RepublicSloveniaSmall statesSomaliaSouth AfricaSouth AsiaSouth Asia (IDA & IBRD)SpainSri LankaSt. LuciaSt. Vincent and the GrenadinesSub-Saharan Africa Sub-Saharan Africa (excluding high income)Sub-Saharan Africa (IDA & IBRD countries)SudanSurinameSwedenSwitzerlandSyrian Arab RepublicTanzaniaThailandTogoTrinidad and TobagoTunisiaTurkeyUgandaUkraineUnited Arab EmiratesUnited KingdomUnited StatesUpper middle incomeUruguayVenezuela, RBVietnamWorldYemen, Rep.ZambiaZimbabwe Timeline:
This timeline shows a graph from 1961 to 2015 of Caribbean small states. No data until 1960. Number of actual observations by date: 55.
Source name:
World Development Indicators
Source organization:
World Bank staff estimates based data from International Monetary Fund's Direction of Trade database.
Categories, topics:
Private Sector, Trade
Last updated:
apr 23, 2017
Indicators value changes by year
At the date of observation
Value
Absolute change
Change from previous value
jan 1, 1961
0.046
+0.046
0.0%
jan 1, 1962
0.0
-0.046
-100.0%
jan 1, 1966
0.023
+0.023
%
jan 1, 1967
0.044
+0.021
95.01%
jan 1, 1968
0.006
-0.038
-87.33%
jan 1, 1969
0.016
+0.01
187.28%
jan 1, 1970
0.287
+0.271
1.69K%
jan 1, 1971
1.287
+1.0
348.78%
jan 1, 1972
0.937
-0.35
-27.18%
jan 1, 1973
0.945
+0.008
0.87%
jan 1, 1974
0.296
-0.649
-68.66%
jan 1, 1975
0.11
-0.186
-62.81%
jan 1, 1976
0.268
+0.158
143.19%
jan 1, 1977
0.193
-0.075
-27.98%
jan 1, 1978
0.023
-0.17
-87.94%
jan 1, 1979
0.021
-0.002
-8.02%
jan 1, 1980
0.244
+0.223
1.04K%
jan 1, 1981
0.521
+0.277
113.7%
jan 1, 1982
0.031
-0.49
-94.05%
jan 1, 1983
0.844
+0.813
2.62K%
jan 1, 1984
0.023
-0.822
-97.32%
jan 1, 1985
0.006
-0.017
-73.06%
jan 1, 1986
0.136
+0.13
2.13K%
jan 1, 1987
0.016
-0.12
-88.16%
jan 1, 1988
0.11
+0.094
585.38%
jan 1, 1989
0.73
+0.619
562.53%
jan 1, 1990
0.364
-0.365
-50.08%
jan 1, 1991
0.503
+0.139
38.07%
jan 1, 1992
0.191
-0.312
-62.08%
jan 1, 1993
0.022
-0.169
-88.57%
jan 1, 1994
0.011
-0.011
-51.56%
jan 1, 1995
0.099
+0.089
840.37%
jan 1, 1996
0.304
+0.205
206.54%
jan 1, 1997
0.16
-0.144
-47.47%
jan 1, 1998
0.11
-0.049
-30.89%
jan 1, 1999
0.109
-0.001
-1.16%
jan 1, 2000
0.198
+0.089
81.19%
jan 1, 2001
0.71
+0.512
259.05%
jan 1, 2002
0.598
-0.113
-15.85%
jan 1, 2003
2.569
+1.971
329.84%
jan 1, 2004
1.323
-1.246
-48.5%
jan 1, 2005
1.372
+0.049
3.67%
jan 1, 2006
1.537
+0.165
12.06%
jan 1, 2007
1.44
-0.097
-6.28%
jan 1, 2008
1.594
+0.154
10.66%
jan 1, 2009
1.418
-0.176
-11.07%
jan 1, 2010
1.402
-0.016
-1.1%
jan 1, 2011
1.549
+0.147
10.45%
jan 1, 2012
1.869
+0.321
20.73%
jan 1, 2013
1.76
-0.109
-5.84%
jan 1, 2014
1.873
+0.113
6.4%
jan 1, 2015
1.841
-0.032
-1.71%
Ranking of countries by current statistics by years


Comments: