29
/
en
AIzaSyAYiBZKx7MnpbEhh9jyipgxe19OcubqV5w
April 1, 2024
101349
Canada
CAN
true
2
1
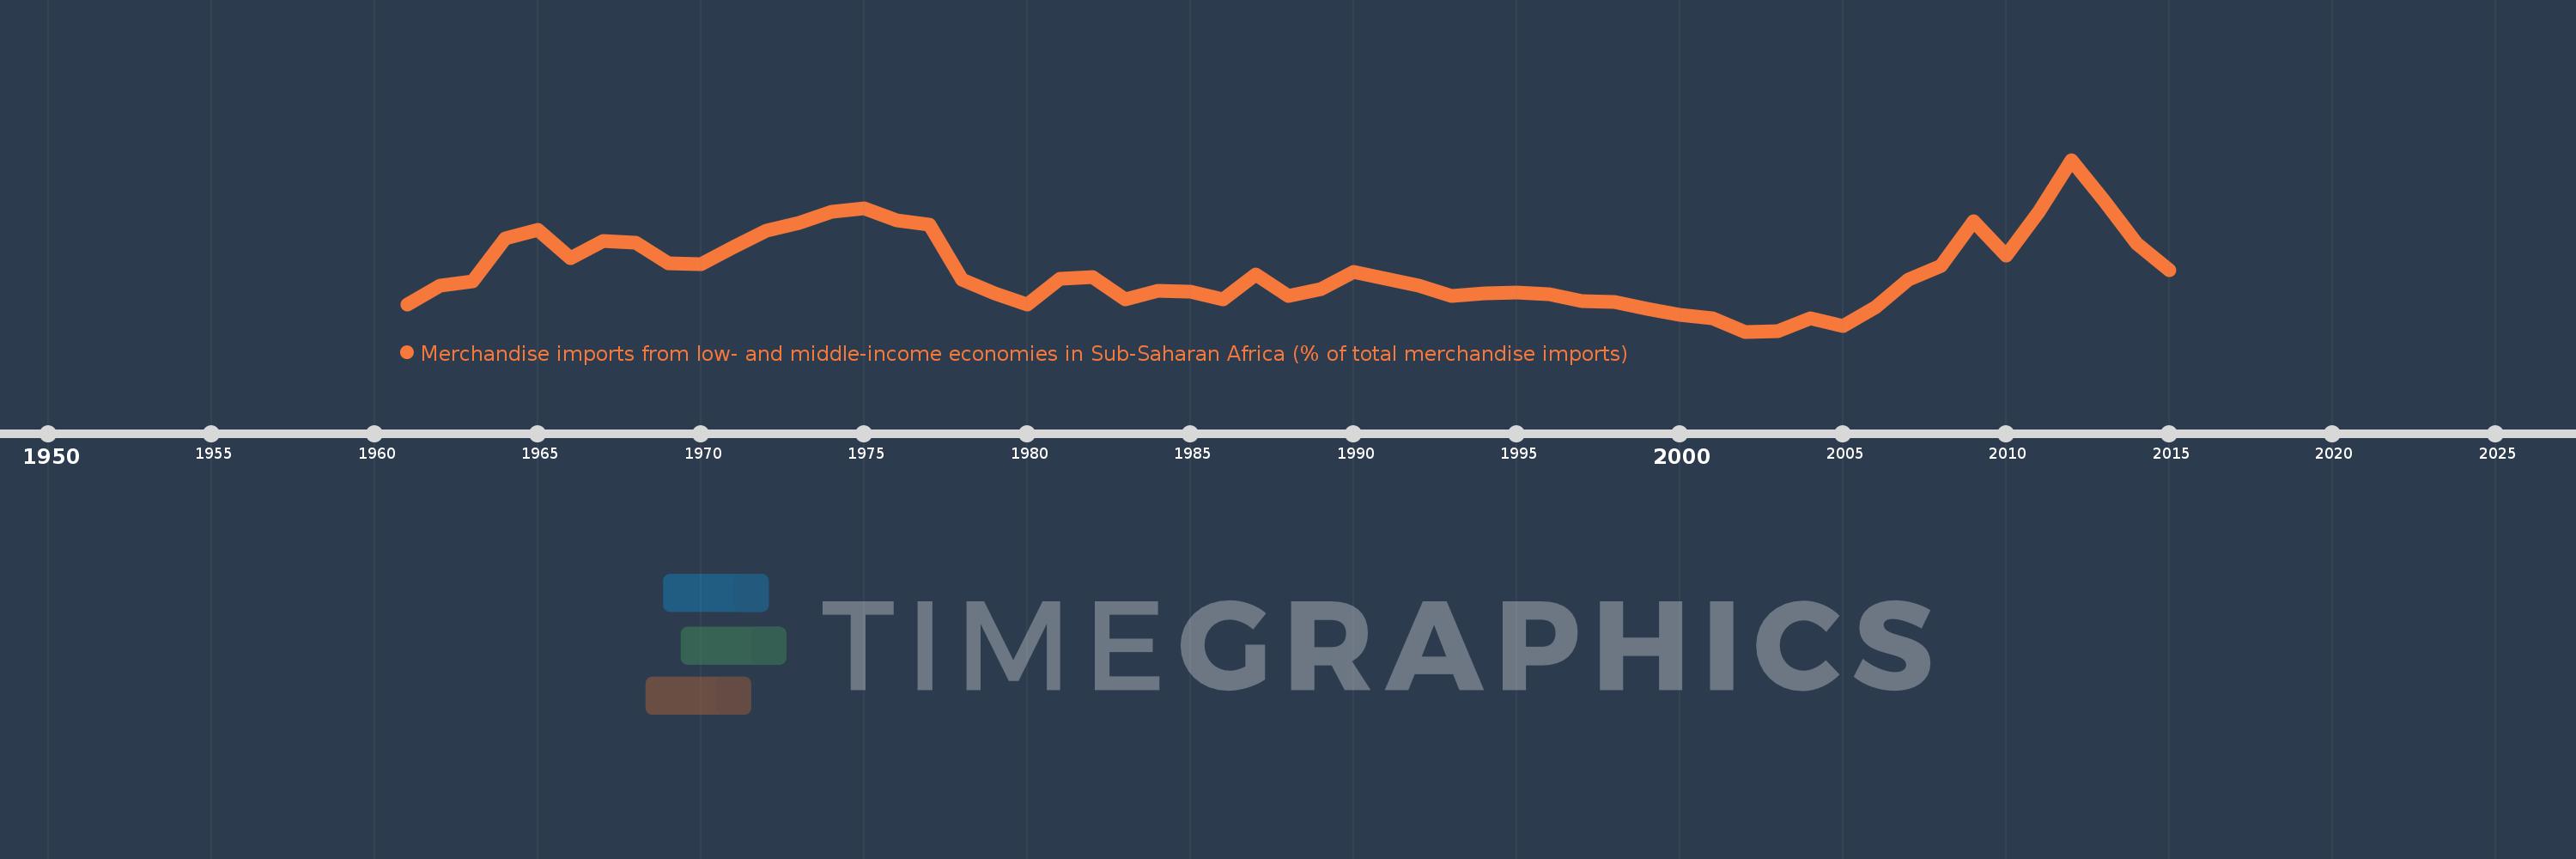
Merchandise imports from low- and middle-income economies in Sub-Saharan Africa (% of total merchandise imports)
2015,2014,2013,2012,2011,2010,2009,2008,2007,2006,2005,2004,2003,2002,2001,2000,1999,1998,1997,1996,1995,1994,1993,1992,1991,1990,1989,1988,1987,1986,1985,1984,1983,1982,1981,1980,1979,1978,1977,1976,1975,1974,1973,1972,1971,1970,1969,1968,1967,1966,1965,1964,1963,1962,1961
This statistics in other country:
AlbaniaAlgeriaAngolaArab WorldArgentinaArmeniaArubaAustraliaAustriaAzerbaijanBahamas, TheBahrainBangladeshBarbadosBelarusBelgiumBelizeBeninBermudaBoliviaBrazilBrunei DarussalamBulgariaBurkina FasoBurundiCabo VerdeCambodiaCameroonCanadaCaribbean small statesCentral African RepublicCentral Europe and the BalticsChadChileChinaColombiaCongo, Dem. Rep.Congo, Rep.Costa RicaCote d'IvoireCroatiaCubaCyprusCzech RepublicDenmarkDjiboutiDominicaDominican RepublicEarly-demographic dividendEast Asia & PacificEast Asia & Pacific (excluding high income)East Asia & Pacific (IDA & IBRD countries)EcuadorEgypt, Arab Rep.El SalvadorEstoniaEthiopiaEuro areaEurope & Central AsiaEurope & Central Asia (excluding high income)Europe & Central Asia (IDA & IBRD countries)European UnionFijiFinlandFragile and conflict affected situationsFranceGabonGambia, TheGeorgiaGermanyGhanaGreeceGreenlandGrenadaGuatemalaGuineaGuinea-BissauGuyanaHaitiHeavily indebted poor countries (HIPC)High incomeHondurasHong Kong SAR, ChinaHungaryIBRD onlyIcelandIDA & IBRD totalIDA blendIDA onlyIDA totalIndiaIndonesiaIran, Islamic Rep.IraqIrelandIsraelItalyJamaicaJapanJordanKazakhstanKenyaKorea, Dem. People’s Rep.Korea, Rep.KuwaitLao PDRLate-demographic dividendLatin America & Caribbean Latin America & Caribbean (excluding high income)Latin America & the Caribbean (IDA & IBRD countries)LatviaLeast developed countries: UN classificationLebanonLiberiaLibyaLithuaniaLow & middle incomeLow incomeLower middle incomeLuxembourgMacao SAR, ChinaMacedonia, FYRMadagascarMalawiMalaysiaMaliMaltaMauritaniaMauritiusMexicoMiddle East & North AfricaMiddle East & North Africa (excluding high income)Middle East & North Africa (IDA & IBRD countries)Middle incomeMoldovaMontenegroMoroccoMozambiqueMyanmarNetherlandsNew CaledoniaNew ZealandNicaraguaNigerNigeriaNorth AmericaNorwayOECD membersOmanOther small statesPacific island small statesPakistanPanamaPapua New GuineaParaguayPeruPhilippinesPolandPortugalPost-demographic dividendPre-demographic dividendQatarRomaniaRussian FederationRwandaSaudi ArabiaSenegalSerbiaSeychellesSierra LeoneSingaporeSlovak RepublicSloveniaSmall statesSomaliaSouth AfricaSouth AsiaSouth Asia (IDA & IBRD)SpainSri LankaSt. LuciaSt. Vincent and the GrenadinesSub-Saharan Africa Sub-Saharan Africa (excluding high income)Sub-Saharan Africa (IDA & IBRD countries)SudanSurinameSwedenSwitzerlandSyrian Arab RepublicTanzaniaThailandTogoTrinidad and TobagoTunisiaTurkeyUgandaUkraineUnited Arab EmiratesUnited KingdomUnited StatesUpper middle incomeUruguayVenezuela, RBVietnamWorldYemen, Rep.ZambiaZimbabwe Timeline:
This timeline shows a graph from 1961 to 2015 of Canada. No data until 1960. Number of actual observations by date: 55.
Source name:
World Development Indicators
Source organization:
World Bank staff estimates based data from International Monetary Fund's Direction of Trade database.
Categories, topics:
Private Sector, Trade
Last updated:
apr 23, 2017
Indicators value changes by year
At the date of observation
Value
Absolute change
Change from previous value
jan 1, 1961
0.499
+0.499
0.0%
jan 1, 1962
0.657
+0.158
31.61%
jan 1, 1963
0.69
+0.033
5.01%
jan 1, 1964
1.049
+0.358
51.94%
jan 1, 1965
1.12
+0.072
6.82%
jan 1, 1966
0.887
-0.234
-20.86%
jan 1, 1967
1.029
+0.142
16.07%
jan 1, 1968
1.015
-0.014
-1.35%
jan 1, 1969
0.838
-0.177
-17.45%
jan 1, 1970
0.835
-0.003
-0.38%
jan 1, 1971
0.98
+0.145
17.4%
jan 1, 1972
1.116
+0.136
13.85%
jan 1, 1973
1.176
+0.06
5.42%
jan 1, 1974
1.272
+0.096
8.14%
jan 1, 1975
1.299
+0.027
2.12%
jan 1, 1976
1.201
-0.098
-7.54%
jan 1, 1977
1.163
-0.039
-3.21%
jan 1, 1978
0.702
-0.46
-39.59%
jan 1, 1979
0.587
-0.115
-16.44%
jan 1, 1980
0.494
-0.092
-15.74%
jan 1, 1981
0.714
+0.219
44.37%
jan 1, 1982
0.725
+0.011
1.58%
jan 1, 1983
0.537
-0.188
-25.95%
jan 1, 1984
0.614
+0.077
14.4%
jan 1, 1985
0.605
-0.01
-1.57%
jan 1, 1986
0.542
-0.063
-10.37%
jan 1, 1987
0.745
+0.203
37.55%
jan 1, 1988
0.569
-0.176
-23.66%
jan 1, 1989
0.622
+0.053
9.29%
jan 1, 1990
0.77
+0.148
23.76%
jan 1, 1991
0.71
-0.06
-7.81%
jan 1, 1992
0.654
-0.056
-7.89%
jan 1, 1993
0.571
-0.083
-12.67%
jan 1, 1994
0.591
+0.02
3.57%
jan 1, 1995
0.595
+0.004
0.66%
jan 1, 1996
0.585
-0.01
-1.76%
jan 1, 1997
0.526
-0.058
-9.95%
jan 1, 1998
0.514
-0.013
-2.41%
jan 1, 1999
0.46
-0.053
-10.37%
jan 1, 2000
0.412
-0.049
-10.53%
jan 1, 2001
0.384
-0.028
-6.68%
jan 1, 2002
0.269
-0.116
-30.12%
jan 1, 2003
0.275
+0.006
2.31%
jan 1, 2004
0.379
+0.104
37.97%
jan 1, 2005
0.318
-0.061
-16.03%
jan 1, 2006
0.477
+0.158
49.75%
jan 1, 2007
0.702
+0.225
47.27%
jan 1, 2008
0.822
+0.12
17.09%
jan 1, 2009
1.191
+0.369
44.87%
jan 1, 2010
0.906
-0.285
-23.95%
jan 1, 2011
1.275
+0.369
40.75%
jan 1, 2012
1.708
+0.433
33.98%
jan 1, 2013
1.367
-0.341
-19.94%
jan 1, 2014
1.003
-0.364
-26.63%
jan 1, 2015
0.787
-0.216
-21.51%
Ranking of countries by current statistics by years


Comments: