29
/
en
AIzaSyAYiBZKx7MnpbEhh9jyipgxe19OcubqV5w
April 1, 2024
152801
Hungary
HUN
true
2
1
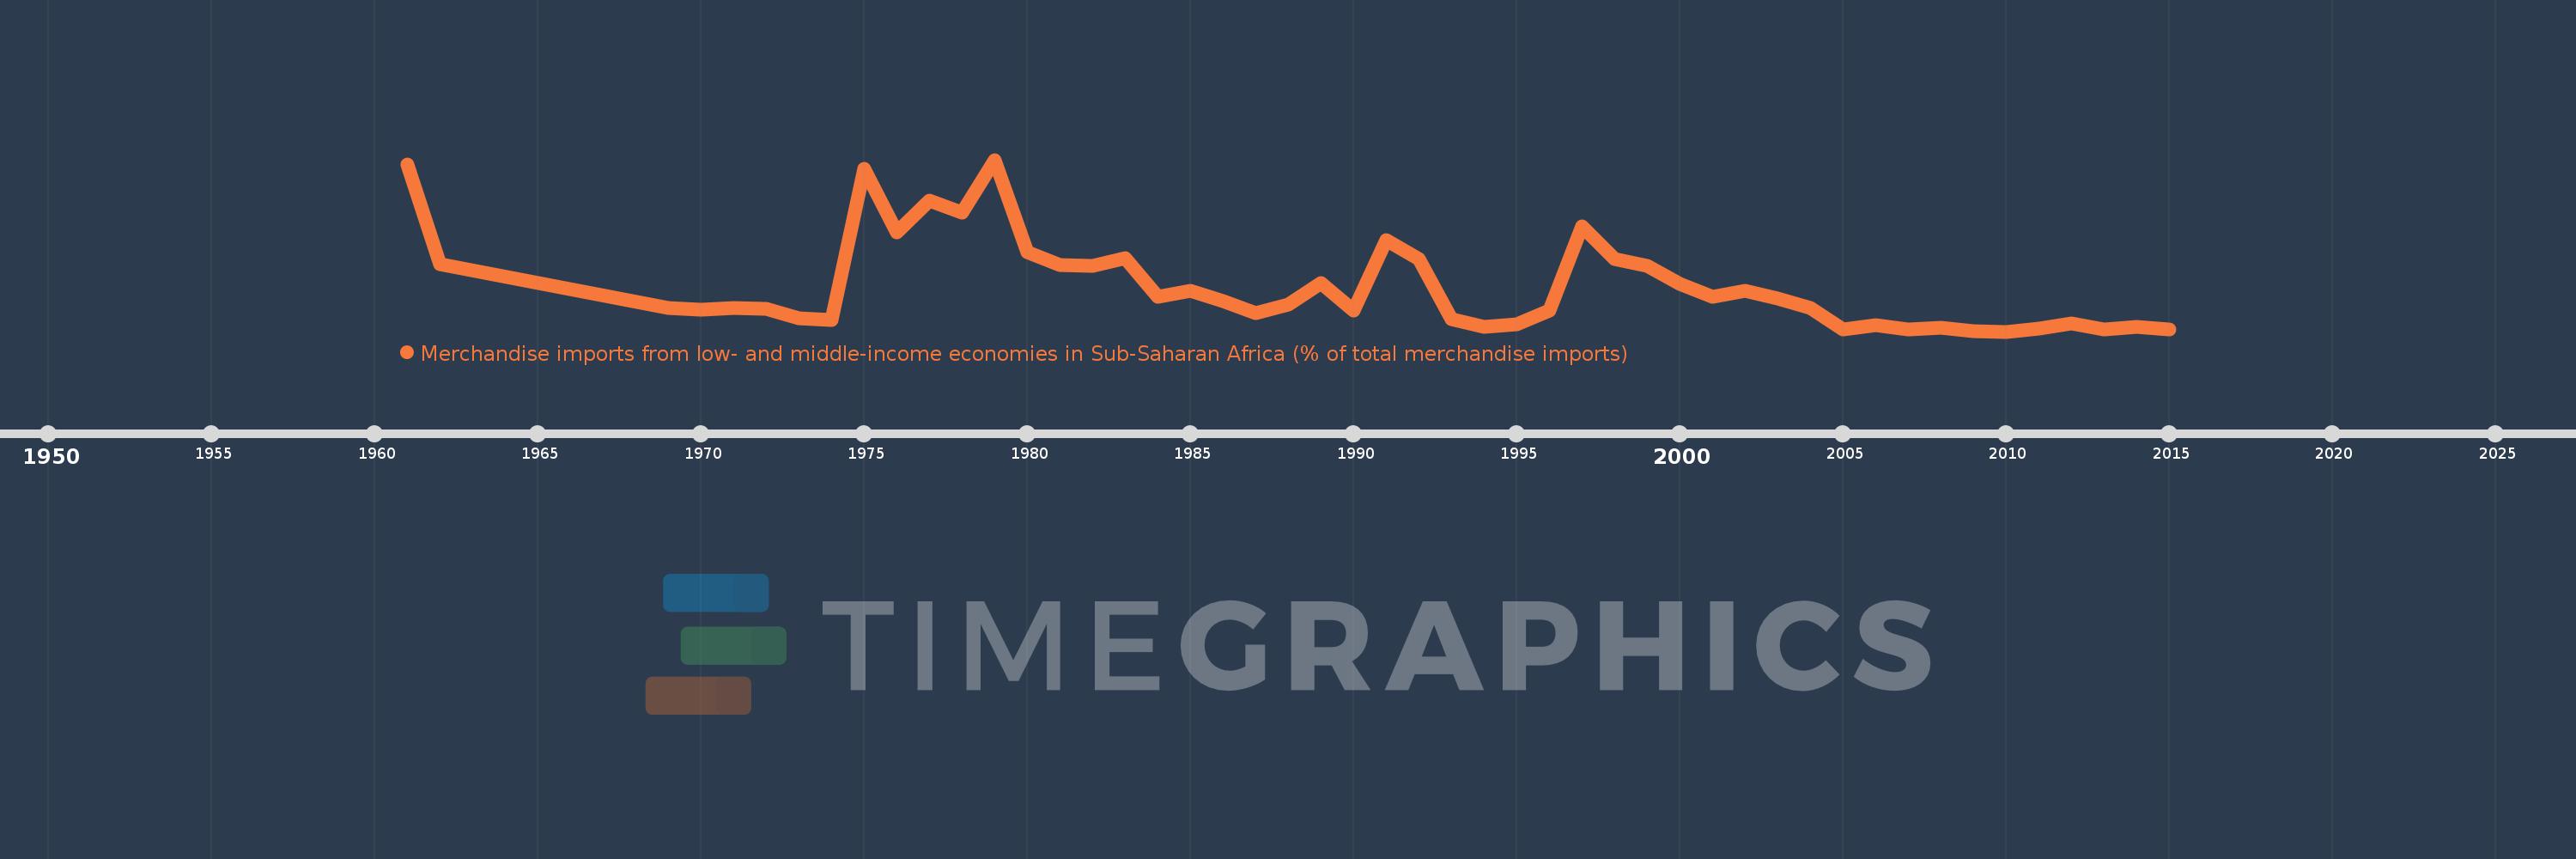
Merchandise imports from low- and middle-income economies in Sub-Saharan Africa (% of total merchandise imports)
2015,2014,2013,2012,2011,2010,2009,2008,2007,2006,2005,2004,2003,2002,2001,2000,1999,1998,1997,1996,1995,1994,1993,1992,1991,1990,1989,1988,1987,1986,1985,1984,1983,1982,1981,1980,1979,1978,1977,1976,1975,1974,1973,1972,1971,1970,1969,1962,1961
This statistics in other country:
AlbaniaAlgeriaAngolaArab WorldArgentinaArmeniaArubaAustraliaAustriaAzerbaijanBahamas, TheBahrainBangladeshBarbadosBelarusBelgiumBelizeBeninBermudaBoliviaBrazilBrunei DarussalamBulgariaBurkina FasoBurundiCabo VerdeCambodiaCameroonCanadaCaribbean small statesCentral African RepublicCentral Europe and the BalticsChadChileChinaColombiaCongo, Dem. Rep.Congo, Rep.Costa RicaCote d'IvoireCroatiaCubaCyprusCzech RepublicDenmarkDjiboutiDominicaDominican RepublicEarly-demographic dividendEast Asia & PacificEast Asia & Pacific (excluding high income)East Asia & Pacific (IDA & IBRD countries)EcuadorEgypt, Arab Rep.El SalvadorEstoniaEthiopiaEuro areaEurope & Central AsiaEurope & Central Asia (excluding high income)Europe & Central Asia (IDA & IBRD countries)European UnionFijiFinlandFragile and conflict affected situationsFranceGabonGambia, TheGeorgiaGermanyGhanaGreeceGreenlandGrenadaGuatemalaGuineaGuinea-BissauGuyanaHaitiHeavily indebted poor countries (HIPC)High incomeHondurasHong Kong SAR, ChinaHungaryIBRD onlyIcelandIDA & IBRD totalIDA blendIDA onlyIDA totalIndiaIndonesiaIran, Islamic Rep.IraqIrelandIsraelItalyJamaicaJapanJordanKazakhstanKenyaKorea, Dem. People’s Rep.Korea, Rep.KuwaitLao PDRLate-demographic dividendLatin America & Caribbean Latin America & Caribbean (excluding high income)Latin America & the Caribbean (IDA & IBRD countries)LatviaLeast developed countries: UN classificationLebanonLiberiaLibyaLithuaniaLow & middle incomeLow incomeLower middle incomeLuxembourgMacao SAR, ChinaMacedonia, FYRMadagascarMalawiMalaysiaMaliMaltaMauritaniaMauritiusMexicoMiddle East & North AfricaMiddle East & North Africa (excluding high income)Middle East & North Africa (IDA & IBRD countries)Middle incomeMoldovaMontenegroMoroccoMozambiqueMyanmarNetherlandsNew CaledoniaNew ZealandNicaraguaNigerNigeriaNorth AmericaNorwayOECD membersOmanOther small statesPacific island small statesPakistanPanamaPapua New GuineaParaguayPeruPhilippinesPolandPortugalPost-demographic dividendPre-demographic dividendQatarRomaniaRussian FederationRwandaSaudi ArabiaSenegalSerbiaSeychellesSierra LeoneSingaporeSlovak RepublicSloveniaSmall statesSomaliaSouth AfricaSouth AsiaSouth Asia (IDA & IBRD)SpainSri LankaSt. LuciaSt. Vincent and the GrenadinesSub-Saharan Africa Sub-Saharan Africa (excluding high income)Sub-Saharan Africa (IDA & IBRD countries)SudanSurinameSwedenSwitzerlandSyrian Arab RepublicTanzaniaThailandTogoTrinidad and TobagoTunisiaTurkeyUgandaUkraineUnited Arab EmiratesUnited KingdomUnited StatesUpper middle incomeUruguayVenezuela, RBVietnamWorldYemen, Rep.ZambiaZimbabwe Timeline:
This timeline shows a graph from 1961 to 2015 of Hungary. No data until 1960. Number of actual observations by date: 49.
Source name:
World Development Indicators
Source organization:
World Bank staff estimates based data from International Monetary Fund's Direction of Trade database.
Categories, topics:
Private Sector, Trade
Last updated:
apr 23, 2017
Indicators value changes by year
At the date of observation
Value
Absolute change
Change from previous value
jan 1, 1961
1.168
+1.168
0.0%
jan 1, 1962
0.489
-0.68
-58.17%
jan 1, 1969
0.191
-0.298
-60.93%
jan 1, 1970
0.183
-0.008
-4.4%
jan 1, 1971
0.192
+0.01
5.29%
jan 1, 1972
0.188
-0.004
-2.11%
jan 1, 1973
0.125
-0.063
-33.74%
jan 1, 1974
0.11
-0.014
-11.59%
jan 1, 1975
1.139
+1.029
933.71%
jan 1, 1976
0.706
-0.433
-37.99%
jan 1, 1977
0.927
+0.22
31.18%
jan 1, 1978
0.844
-0.083
-8.97%
jan 1, 1979
1.203
+0.359
42.58%
jan 1, 1980
0.576
-0.627
-52.12%
jan 1, 1981
0.486
-0.09
-15.64%
jan 1, 1982
0.479
-0.007
-1.35%
jan 1, 1983
0.531
+0.052
10.8%
jan 1, 1984
0.272
-0.259
-48.76%
jan 1, 1985
0.312
+0.04
14.6%
jan 1, 1986
0.238
-0.073
-23.53%
jan 1, 1987
0.159
-0.08
-33.35%
jan 1, 1988
0.219
+0.06
37.55%
jan 1, 1989
0.362
+0.144
65.7%
jan 1, 1990
0.178
-0.184
-50.75%
jan 1, 1991
0.653
+0.474
265.9%
jan 1, 1992
0.527
-0.126
-19.27%
jan 1, 1993
0.118
-0.409
-77.63%
jan 1, 1994
0.067
-0.051
-43.17%
jan 1, 1995
0.083
+0.016
23.94%
jan 1, 1996
0.173
+0.09
108.42%
jan 1, 1997
0.747
+0.574
331.75%
jan 1, 1998
0.529
-0.218
-29.19%
jan 1, 1999
0.477
-0.052
-9.91%
jan 1, 2000
0.359
-0.118
-24.7%
jan 1, 2001
0.268
-0.091
-25.31%
jan 1, 2002
0.309
+0.04
15.1%
jan 1, 2003
0.255
-0.053
-17.32%
jan 1, 2004
0.195
-0.06
-23.71%
jan 1, 2005
0.047
-0.147
-75.76%
jan 1, 2006
0.075
+0.028
59.48%
jan 1, 2007
0.046
-0.029
-38.49%
jan 1, 2008
0.06
+0.014
30.43%
jan 1, 2009
0.033
-0.027
-45.25%
jan 1, 2010
0.032
-0.001
-3.91%
jan 1, 2011
0.052
+0.02
63.88%
jan 1, 2012
0.086
+0.034
65.77%
jan 1, 2013
0.048
-0.038
-43.97%
jan 1, 2014
0.067
+0.019
38.53%
jan 1, 2015
0.049
-0.018
-27.34%
Ranking of countries by current statistics by years


Comments: