29
/
en
AIzaSyAYiBZKx7MnpbEhh9jyipgxe19OcubqV5w
April 1, 2024
36777
IBRD only
IBD
false
2
1
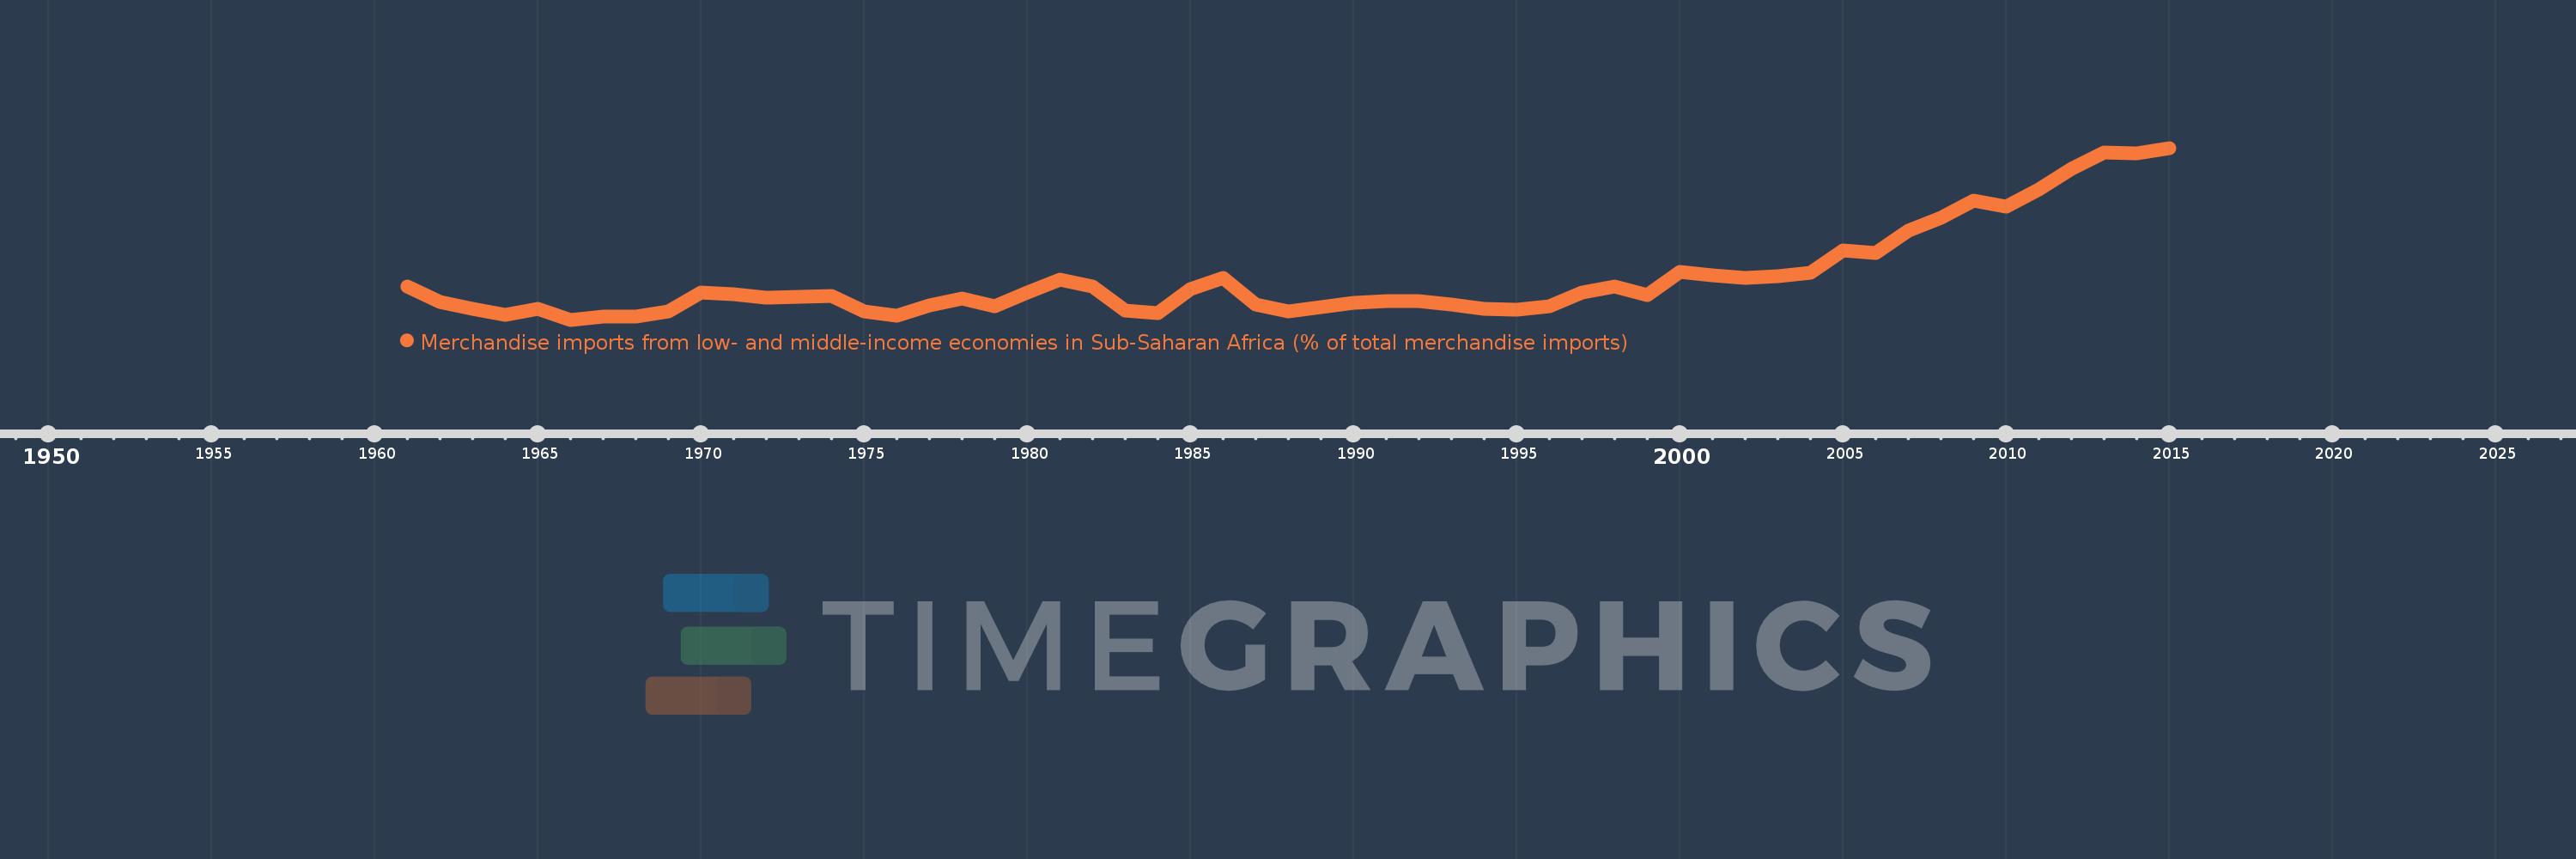
Merchandise imports from low- and middle-income economies in Sub-Saharan Africa (% of total merchandise imports)
2015,2014,2013,2012,2011,2010,2009,2008,2007,2006,2005,2004,2003,2002,2001,2000,1999,1998,1997,1996,1995,1994,1993,1992,1991,1990,1989,1988,1987,1986,1985,1984,1983,1982,1981,1980,1979,1978,1977,1976,1975,1974,1973,1972,1971,1970,1969,1968,1967,1966,1965,1964,1963,1962,1961
This statistics in other country:
AlbaniaAlgeriaAngolaArab WorldArgentinaArmeniaArubaAustraliaAustriaAzerbaijanBahamas, TheBahrainBangladeshBarbadosBelarusBelgiumBelizeBeninBermudaBoliviaBrazilBrunei DarussalamBulgariaBurkina FasoBurundiCabo VerdeCambodiaCameroonCanadaCaribbean small statesCentral African RepublicCentral Europe and the BalticsChadChileChinaColombiaCongo, Dem. Rep.Congo, Rep.Costa RicaCote d'IvoireCroatiaCubaCyprusCzech RepublicDenmarkDjiboutiDominicaDominican RepublicEarly-demographic dividendEast Asia & PacificEast Asia & Pacific (excluding high income)East Asia & Pacific (IDA & IBRD countries)EcuadorEgypt, Arab Rep.El SalvadorEstoniaEthiopiaEuro areaEurope & Central AsiaEurope & Central Asia (excluding high income)Europe & Central Asia (IDA & IBRD countries)European UnionFijiFinlandFragile and conflict affected situationsFranceGabonGambia, TheGeorgiaGermanyGhanaGreeceGreenlandGrenadaGuatemalaGuineaGuinea-BissauGuyanaHaitiHeavily indebted poor countries (HIPC)High incomeHondurasHong Kong SAR, ChinaHungaryIBRD onlyIcelandIDA & IBRD totalIDA blendIDA onlyIDA totalIndiaIndonesiaIran, Islamic Rep.IraqIrelandIsraelItalyJamaicaJapanJordanKazakhstanKenyaKorea, Dem. People’s Rep.Korea, Rep.KuwaitLao PDRLate-demographic dividendLatin America & Caribbean Latin America & Caribbean (excluding high income)Latin America & the Caribbean (IDA & IBRD countries)LatviaLeast developed countries: UN classificationLebanonLiberiaLibyaLithuaniaLow & middle incomeLow incomeLower middle incomeLuxembourgMacao SAR, ChinaMacedonia, FYRMadagascarMalawiMalaysiaMaliMaltaMauritaniaMauritiusMexicoMiddle East & North AfricaMiddle East & North Africa (excluding high income)Middle East & North Africa (IDA & IBRD countries)Middle incomeMoldovaMontenegroMoroccoMozambiqueMyanmarNetherlandsNew CaledoniaNew ZealandNicaraguaNigerNigeriaNorth AmericaNorwayOECD membersOmanOther small statesPacific island small statesPakistanPanamaPapua New GuineaParaguayPeruPhilippinesPolandPortugalPost-demographic dividendPre-demographic dividendQatarRomaniaRussian FederationRwandaSaudi ArabiaSenegalSerbiaSeychellesSierra LeoneSingaporeSlovak RepublicSloveniaSmall statesSomaliaSouth AfricaSouth AsiaSouth Asia (IDA & IBRD)SpainSri LankaSt. LuciaSt. Vincent and the GrenadinesSub-Saharan Africa Sub-Saharan Africa (excluding high income)Sub-Saharan Africa (IDA & IBRD countries)SudanSurinameSwedenSwitzerlandSyrian Arab RepublicTanzaniaThailandTogoTrinidad and TobagoTunisiaTurkeyUgandaUkraineUnited Arab EmiratesUnited KingdomUnited StatesUpper middle incomeUruguayVenezuela, RBVietnamWorldYemen, Rep.ZambiaZimbabwe Timeline:
This timeline shows a graph from 1961 to 2015 of IBRD only. No data until 1960. Number of actual observations by date: 55.
Source name:
World Development Indicators
Source organization:
World Bank staff estimates based data from International Monetary Fund's Direction of Trade database.
Categories, topics:
Private Sector, Trade
Last updated:
apr 23, 2017
Indicators value changes by year
At the date of observation
Value
Absolute change
Change from previous value
jan 1, 1961
1.166
+1.166
0.0%
jan 1, 1962
0.931
-0.235
-20.18%
jan 1, 1963
0.823
-0.108
-11.62%
jan 1, 1964
0.736
-0.087
-10.59%
jan 1, 1965
0.826
+0.09
12.27%
jan 1, 1966
0.662
-0.164
-19.88%
jan 1, 1967
0.704
+0.042
6.42%
jan 1, 1968
0.712
+0.008
1.18%
jan 1, 1969
0.791
+0.078
10.99%
jan 1, 1970
1.074
+0.283
35.84%
jan 1, 1971
1.042
-0.032
-2.97%
jan 1, 1972
0.991
-0.051
-4.91%
jan 1, 1973
1.005
+0.014
1.37%
jan 1, 1974
1.026
+0.021
2.07%
jan 1, 1975
0.788
-0.238
-23.16%
jan 1, 1976
0.726
-0.062
-7.93%
jan 1, 1977
0.873
+0.147
20.26%
jan 1, 1978
0.987
+0.114
13.05%
jan 1, 1979
0.861
-0.125
-12.68%
jan 1, 1980
1.074
+0.212
24.65%
jan 1, 1981
1.263
+0.189
17.63%
jan 1, 1982
1.167
-0.096
-7.63%
jan 1, 1983
0.804
-0.363
-31.07%
jan 1, 1984
0.762
-0.042
-5.2%
jan 1, 1985
1.125
+0.363
47.56%
jan 1, 1986
1.291
+0.166
14.77%
jan 1, 1987
0.891
-0.401
-31.02%
jan 1, 1988
0.789
-0.101
-11.35%
jan 1, 1989
0.855
+0.066
8.34%
jan 1, 1990
0.921
+0.066
7.68%
jan 1, 1991
0.947
+0.027
2.88%
jan 1, 1992
0.94
-0.008
-0.83%
jan 1, 1993
0.897
-0.042
-4.5%
jan 1, 1994
0.828
-0.069
-7.69%
jan 1, 1995
0.818
-0.01
-1.23%
jan 1, 1996
0.862
+0.044
5.38%
jan 1, 1997
1.076
+0.213
24.76%
jan 1, 1998
1.165
+0.09
8.35%
jan 1, 1999
1.028
-0.137
-11.76%
jan 1, 2000
1.387
+0.359
34.93%
jan 1, 2001
1.331
-0.057
-4.1%
jan 1, 2002
1.29
-0.04
-3.01%
jan 1, 2003
1.326
+0.036
2.75%
jan 1, 2004
1.369
+0.043
3.25%
jan 1, 2005
1.715
+0.346
25.29%
jan 1, 2006
1.674
-0.041
-2.42%
jan 1, 2007
2.008
+0.334
19.94%
jan 1, 2008
2.207
+0.199
9.92%
jan 1, 2009
2.464
+0.257
11.65%
jan 1, 2010
2.368
-0.096
-3.89%
jan 1, 2011
2.626
+0.258
10.9%
jan 1, 2012
2.939
+0.313
11.91%
jan 1, 2013
3.189
+0.25
8.51%
jan 1, 2014
3.172
-0.017
-0.55%
jan 1, 2015
3.256
+0.084
2.65%
Ranking of countries by current statistics by years


Comments: