29
/
en
AIzaSyAYiBZKx7MnpbEhh9jyipgxe19OcubqV5w
April 1, 2024
51133
Middle income
MIC
false
2
1
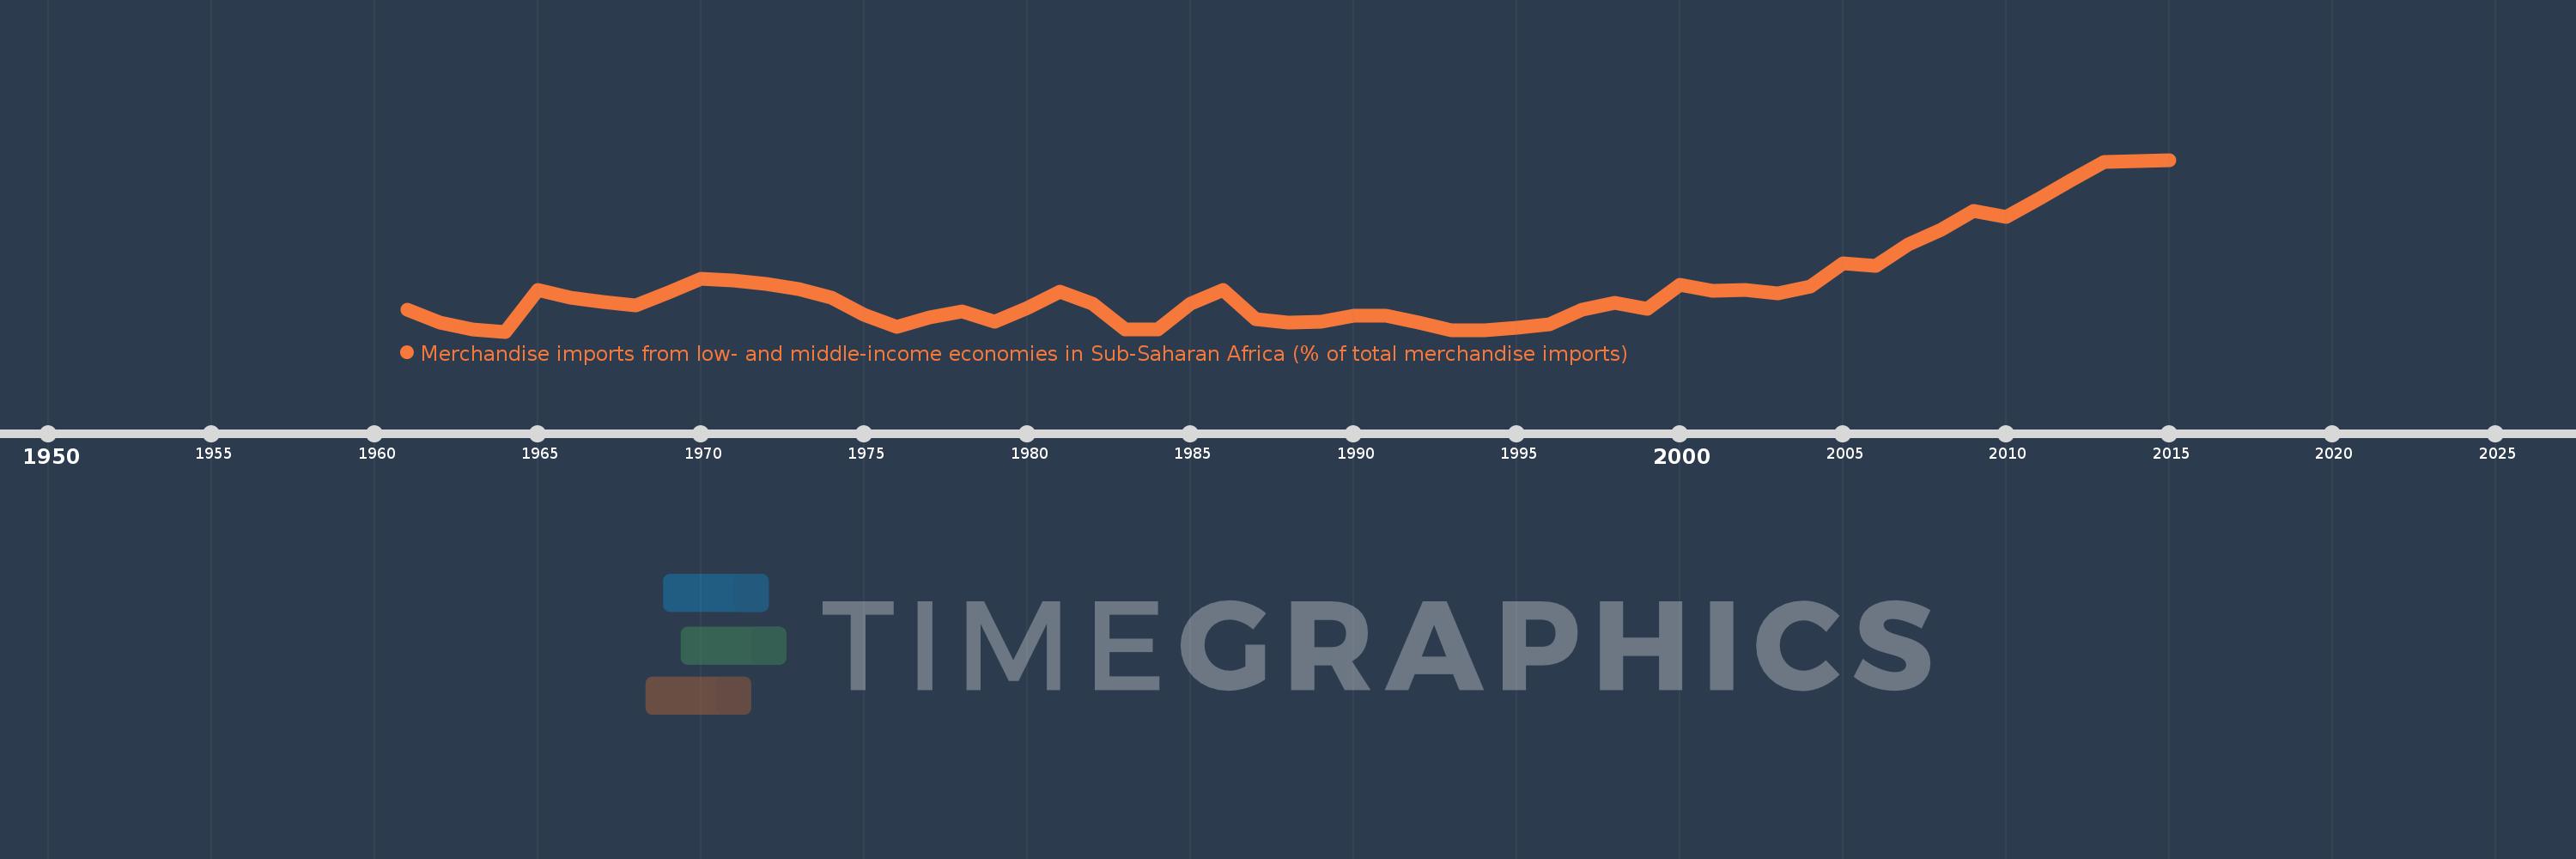
Merchandise imports from low- and middle-income economies in Sub-Saharan Africa (% of total merchandise imports)
2015,2014,2013,2012,2011,2010,2009,2008,2007,2006,2005,2004,2003,2002,2001,2000,1999,1998,1997,1996,1995,1994,1993,1992,1991,1990,1989,1988,1987,1986,1985,1984,1983,1982,1981,1980,1979,1978,1977,1976,1975,1974,1973,1972,1971,1970,1969,1968,1967,1966,1965,1964,1963,1962,1961
This statistics in other country:
AlbaniaAlgeriaAngolaArab WorldArgentinaArmeniaArubaAustraliaAustriaAzerbaijanBahamas, TheBahrainBangladeshBarbadosBelarusBelgiumBelizeBeninBermudaBoliviaBrazilBrunei DarussalamBulgariaBurkina FasoBurundiCabo VerdeCambodiaCameroonCanadaCaribbean small statesCentral African RepublicCentral Europe and the BalticsChadChileChinaColombiaCongo, Dem. Rep.Congo, Rep.Costa RicaCote d'IvoireCroatiaCubaCyprusCzech RepublicDenmarkDjiboutiDominicaDominican RepublicEarly-demographic dividendEast Asia & PacificEast Asia & Pacific (excluding high income)East Asia & Pacific (IDA & IBRD countries)EcuadorEgypt, Arab Rep.El SalvadorEstoniaEthiopiaEuro areaEurope & Central AsiaEurope & Central Asia (excluding high income)Europe & Central Asia (IDA & IBRD countries)European UnionFijiFinlandFragile and conflict affected situationsFranceGabonGambia, TheGeorgiaGermanyGhanaGreeceGreenlandGrenadaGuatemalaGuineaGuinea-BissauGuyanaHaitiHeavily indebted poor countries (HIPC)High incomeHondurasHong Kong SAR, ChinaHungaryIBRD onlyIcelandIDA & IBRD totalIDA blendIDA onlyIDA totalIndiaIndonesiaIran, Islamic Rep.IraqIrelandIsraelItalyJamaicaJapanJordanKazakhstanKenyaKorea, Dem. People’s Rep.Korea, Rep.KuwaitLao PDRLate-demographic dividendLatin America & Caribbean Latin America & Caribbean (excluding high income)Latin America & the Caribbean (IDA & IBRD countries)LatviaLeast developed countries: UN classificationLebanonLiberiaLibyaLithuaniaLow & middle incomeLow incomeLower middle incomeLuxembourgMacao SAR, ChinaMacedonia, FYRMadagascarMalawiMalaysiaMaliMaltaMauritaniaMauritiusMexicoMiddle East & North AfricaMiddle East & North Africa (excluding high income)Middle East & North Africa (IDA & IBRD countries)Middle incomeMoldovaMontenegroMoroccoMozambiqueMyanmarNetherlandsNew CaledoniaNew ZealandNicaraguaNigerNigeriaNorth AmericaNorwayOECD membersOmanOther small statesPacific island small statesPakistanPanamaPapua New GuineaParaguayPeruPhilippinesPolandPortugalPost-demographic dividendPre-demographic dividendQatarRomaniaRussian FederationRwandaSaudi ArabiaSenegalSerbiaSeychellesSierra LeoneSingaporeSlovak RepublicSloveniaSmall statesSomaliaSouth AfricaSouth AsiaSouth Asia (IDA & IBRD)SpainSri LankaSt. LuciaSt. Vincent and the GrenadinesSub-Saharan Africa Sub-Saharan Africa (excluding high income)Sub-Saharan Africa (IDA & IBRD countries)SudanSurinameSwedenSwitzerlandSyrian Arab RepublicTanzaniaThailandTogoTrinidad and TobagoTunisiaTurkeyUgandaUkraineUnited Arab EmiratesUnited KingdomUnited StatesUpper middle incomeUruguayVenezuela, RBVietnamWorldYemen, Rep.ZambiaZimbabwe Timeline:
This timeline shows a graph from 1961 to 2015 of Middle income. No data until 1960. Number of actual observations by date: 55.
Source name:
World Development Indicators
Source organization:
World Bank staff estimates based data from International Monetary Fund's Direction of Trade database.
Categories, topics:
Private Sector, Trade
Last updated:
apr 23, 2017
Indicators value changes by year
At the date of observation
Value
Absolute change
Change from previous value
jan 1, 1961
1.279
+1.279
0.0%
jan 1, 1962
1.087
-0.192
-15.02%
jan 1, 1963
0.991
-0.097
-8.88%
jan 1, 1964
0.964
-0.027
-2.74%
jan 1, 1965
1.556
+0.592
61.47%
jan 1, 1966
1.445
-0.111
-7.11%
jan 1, 1967
1.39
-0.055
-3.83%
jan 1, 1968
1.332
-0.058
-4.17%
jan 1, 1969
1.522
+0.19
14.29%
jan 1, 1970
1.713
+0.191
12.52%
jan 1, 1971
1.693
-0.02
-1.18%
jan 1, 1972
1.644
-0.049
-2.91%
jan 1, 1973
1.571
-0.073
-4.43%
jan 1, 1974
1.452
-0.119
-7.58%
jan 1, 1975
1.199
-0.252
-17.39%
jan 1, 1976
1.037
-0.162
-13.51%
jan 1, 1977
1.164
+0.127
12.26%
jan 1, 1978
1.256
+0.092
7.88%
jan 1, 1979
1.108
-0.148
-11.77%
jan 1, 1980
1.306
+0.198
17.83%
jan 1, 1981
1.534
+0.228
17.43%
jan 1, 1982
1.356
-0.178
-11.6%
jan 1, 1983
1.0
-0.356
-26.28%
jan 1, 1984
0.993
-0.007
-0.66%
jan 1, 1985
1.356
+0.363
36.55%
jan 1, 1986
1.555
+0.199
14.66%
jan 1, 1987
1.147
-0.408
-26.22%
jan 1, 1988
1.091
-0.056
-4.85%
jan 1, 1989
1.102
+0.01
0.94%
jan 1, 1990
1.186
+0.084
7.66%
jan 1, 1991
1.193
+0.007
0.57%
jan 1, 1992
1.09
-0.103
-8.63%
jan 1, 1993
0.986
-0.104
-9.51%
jan 1, 1994
0.987
+0.001
0.13%
jan 1, 1995
1.016
+0.028
2.84%
jan 1, 1996
1.065
+0.049
4.82%
jan 1, 1997
1.276
+0.212
19.89%
jan 1, 1998
1.379
+0.103
8.04%
jan 1, 1999
1.29
-0.089
-6.45%
jan 1, 2000
1.635
+0.345
26.76%
jan 1, 2001
1.543
-0.092
-5.64%
jan 1, 2002
1.555
+0.012
0.78%
jan 1, 2003
1.509
-0.046
-2.94%
jan 1, 2004
1.611
+0.102
6.79%
jan 1, 2005
1.934
+0.322
20.0%
jan 1, 2006
1.902
-0.031
-1.62%
jan 1, 2007
2.207
+0.304
15.99%
jan 1, 2008
2.408
+0.201
9.12%
jan 1, 2009
2.678
+0.27
11.23%
jan 1, 2010
2.593
-0.085
-3.19%
jan 1, 2011
2.854
+0.261
10.08%
jan 1, 2012
3.124
+0.269
9.44%
jan 1, 2013
3.38
+0.257
8.21%
jan 1, 2014
3.396
+0.016
0.48%
jan 1, 2015
3.41
+0.014
0.41%
Ranking of countries by current statistics by years


Comments: