29
/
en
AIzaSyAYiBZKx7MnpbEhh9jyipgxe19OcubqV5w
April 1, 2024
43653
Latin America & the Caribbean (IDA & IBRD countries)
TLA
false
2
1
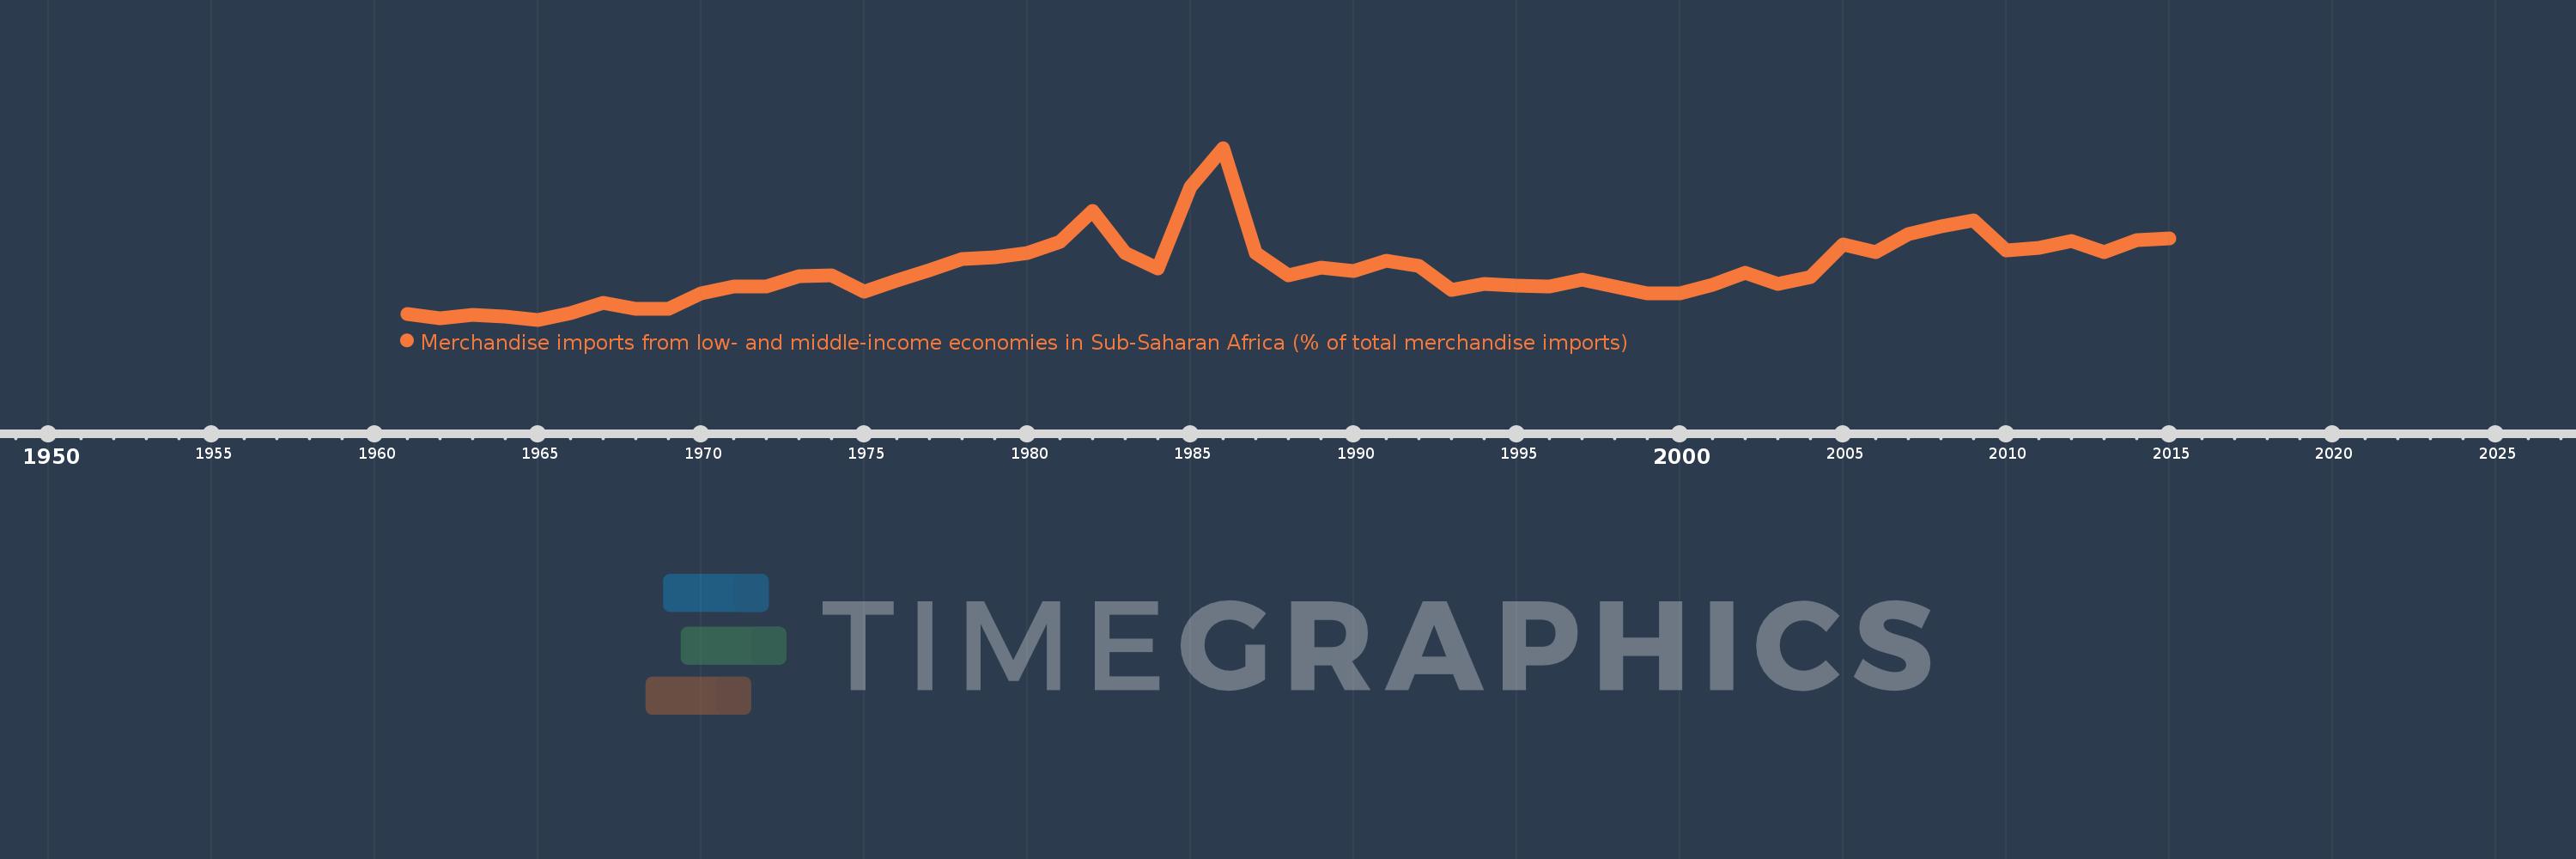
Merchandise imports from low- and middle-income economies in Sub-Saharan Africa (% of total merchandise imports)
2015,2014,2013,2012,2011,2010,2009,2008,2007,2006,2005,2004,2003,2002,2001,2000,1999,1998,1997,1996,1995,1994,1993,1992,1991,1990,1989,1988,1987,1986,1985,1984,1983,1982,1981,1980,1979,1978,1977,1976,1975,1974,1973,1972,1971,1970,1969,1968,1967,1966,1965,1964,1963,1962,1961
This statistics in other country:
AlbaniaAlgeriaAngolaArab WorldArgentinaArmeniaArubaAustraliaAustriaAzerbaijanBahamas, TheBahrainBangladeshBarbadosBelarusBelgiumBelizeBeninBermudaBoliviaBrazilBrunei DarussalamBulgariaBurkina FasoBurundiCabo VerdeCambodiaCameroonCanadaCaribbean small statesCentral African RepublicCentral Europe and the BalticsChadChileChinaColombiaCongo, Dem. Rep.Congo, Rep.Costa RicaCote d'IvoireCroatiaCubaCyprusCzech RepublicDenmarkDjiboutiDominicaDominican RepublicEarly-demographic dividendEast Asia & PacificEast Asia & Pacific (excluding high income)East Asia & Pacific (IDA & IBRD countries)EcuadorEgypt, Arab Rep.El SalvadorEstoniaEthiopiaEuro areaEurope & Central AsiaEurope & Central Asia (excluding high income)Europe & Central Asia (IDA & IBRD countries)European UnionFijiFinlandFragile and conflict affected situationsFranceGabonGambia, TheGeorgiaGermanyGhanaGreeceGreenlandGrenadaGuatemalaGuineaGuinea-BissauGuyanaHaitiHeavily indebted poor countries (HIPC)High incomeHondurasHong Kong SAR, ChinaHungaryIBRD onlyIcelandIDA & IBRD totalIDA blendIDA onlyIDA totalIndiaIndonesiaIran, Islamic Rep.IraqIrelandIsraelItalyJamaicaJapanJordanKazakhstanKenyaKorea, Dem. People’s Rep.Korea, Rep.KuwaitLao PDRLate-demographic dividendLatin America & Caribbean Latin America & Caribbean (excluding high income)Latin America & the Caribbean (IDA & IBRD countries)LatviaLeast developed countries: UN classificationLebanonLiberiaLibyaLithuaniaLow & middle incomeLow incomeLower middle incomeLuxembourgMacao SAR, ChinaMacedonia, FYRMadagascarMalawiMalaysiaMaliMaltaMauritaniaMauritiusMexicoMiddle East & North AfricaMiddle East & North Africa (excluding high income)Middle East & North Africa (IDA & IBRD countries)Middle incomeMoldovaMontenegroMoroccoMozambiqueMyanmarNetherlandsNew CaledoniaNew ZealandNicaraguaNigerNigeriaNorth AmericaNorwayOECD membersOmanOther small statesPacific island small statesPakistanPanamaPapua New GuineaParaguayPeruPhilippinesPolandPortugalPost-demographic dividendPre-demographic dividendQatarRomaniaRussian FederationRwandaSaudi ArabiaSenegalSerbiaSeychellesSierra LeoneSingaporeSlovak RepublicSloveniaSmall statesSomaliaSouth AfricaSouth AsiaSouth Asia (IDA & IBRD)SpainSri LankaSt. LuciaSt. Vincent and the GrenadinesSub-Saharan Africa Sub-Saharan Africa (excluding high income)Sub-Saharan Africa (IDA & IBRD countries)SudanSurinameSwedenSwitzerlandSyrian Arab RepublicTanzaniaThailandTogoTrinidad and TobagoTunisiaTurkeyUgandaUkraineUnited Arab EmiratesUnited KingdomUnited StatesUpper middle incomeUruguayVenezuela, RBVietnamWorldYemen, Rep.ZambiaZimbabwe Timeline:
This timeline shows a graph from 1961 to 2015 of Latin America & the Caribbean (IDA & IBRD countries). No data until 1960. Number of actual observations by date: 55.
Source name:
World Development Indicators
Source organization:
World Bank staff estimates based data from International Monetary Fund's Direction of Trade database.
Categories, topics:
Private Sector, Trade
Last updated:
apr 23, 2017
Indicators value changes by year
At the date of observation
Value
Absolute change
Change from previous value
jan 1, 1961
0.206
+0.206
0.0%
jan 1, 1962
0.127
-0.079
-38.29%
jan 1, 1963
0.184
+0.057
44.64%
jan 1, 1964
0.163
-0.02
-11.02%
jan 1, 1965
0.109
-0.054
-33.17%
jan 1, 1966
0.221
+0.112
102.17%
jan 1, 1967
0.391
+0.17
77.07%
jan 1, 1968
0.282
-0.109
-27.95%
jan 1, 1969
0.292
+0.011
3.86%
jan 1, 1970
0.538
+0.246
84.14%
jan 1, 1971
0.652
+0.114
21.14%
jan 1, 1972
0.655
+0.003
0.41%
jan 1, 1973
0.831
+0.176
26.91%
jan 1, 1974
0.836
+0.005
0.63%
jan 1, 1975
0.574
-0.263
-31.41%
jan 1, 1976
0.754
+0.18
31.45%
jan 1, 1977
0.931
+0.177
23.43%
jan 1, 1978
1.106
+0.175
18.82%
jan 1, 1979
1.139
+0.033
3.01%
jan 1, 1980
1.213
+0.074
6.5%
jan 1, 1981
1.386
+0.173
14.26%
jan 1, 1982
1.903
+0.517
37.27%
jan 1, 1983
1.214
-0.688
-36.17%
jan 1, 1984
0.956
-0.258
-21.27%
jan 1, 1985
2.302
+1.346
140.8%
jan 1, 1986
2.938
+0.636
27.63%
jan 1, 1987
1.206
-1.733
-58.97%
jan 1, 1988
0.843
-0.363
-30.1%
jan 1, 1989
0.967
+0.124
14.72%
jan 1, 1990
0.91
-0.056
-5.84%
jan 1, 1991
1.082
+0.172
18.89%
jan 1, 1992
0.99
-0.092
-8.49%
jan 1, 1993
0.601
-0.39
-39.33%
jan 1, 1994
0.7
+0.099
16.41%
jan 1, 1995
0.671
-0.029
-4.1%
jan 1, 1996
0.651
-0.02
-2.93%
jan 1, 1997
0.769
+0.118
18.07%
jan 1, 1998
0.66
-0.109
-14.16%
jan 1, 1999
0.543
-0.117
-17.8%
jan 1, 2000
0.541
-0.002
-0.29%
jan 1, 2001
0.689
+0.148
27.43%
jan 1, 2002
0.877
+0.188
27.29%
jan 1, 2003
0.697
-0.181
-20.6%
jan 1, 2004
0.814
+0.118
16.89%
jan 1, 2005
1.351
+0.537
65.95%
jan 1, 2006
1.22
-0.132
-9.75%
jan 1, 2007
1.519
+0.3
24.58%
jan 1, 2008
1.64
+0.12
7.92%
jan 1, 2009
1.751
+0.111
6.77%
jan 1, 2010
1.252
-0.499
-28.51%
jan 1, 2011
1.29
+0.038
3.03%
jan 1, 2012
1.408
+0.118
9.14%
jan 1, 2013
1.229
-0.179
-12.7%
jan 1, 2014
1.419
+0.19
15.47%
jan 1, 2015
1.445
+0.026
1.81%
Ranking of countries by current statistics by years


Comments: