29
/
en
AIzaSyAYiBZKx7MnpbEhh9jyipgxe19OcubqV5w
April 1, 2024
44446
Least developed countries: UN classification
LDC
false
2
1
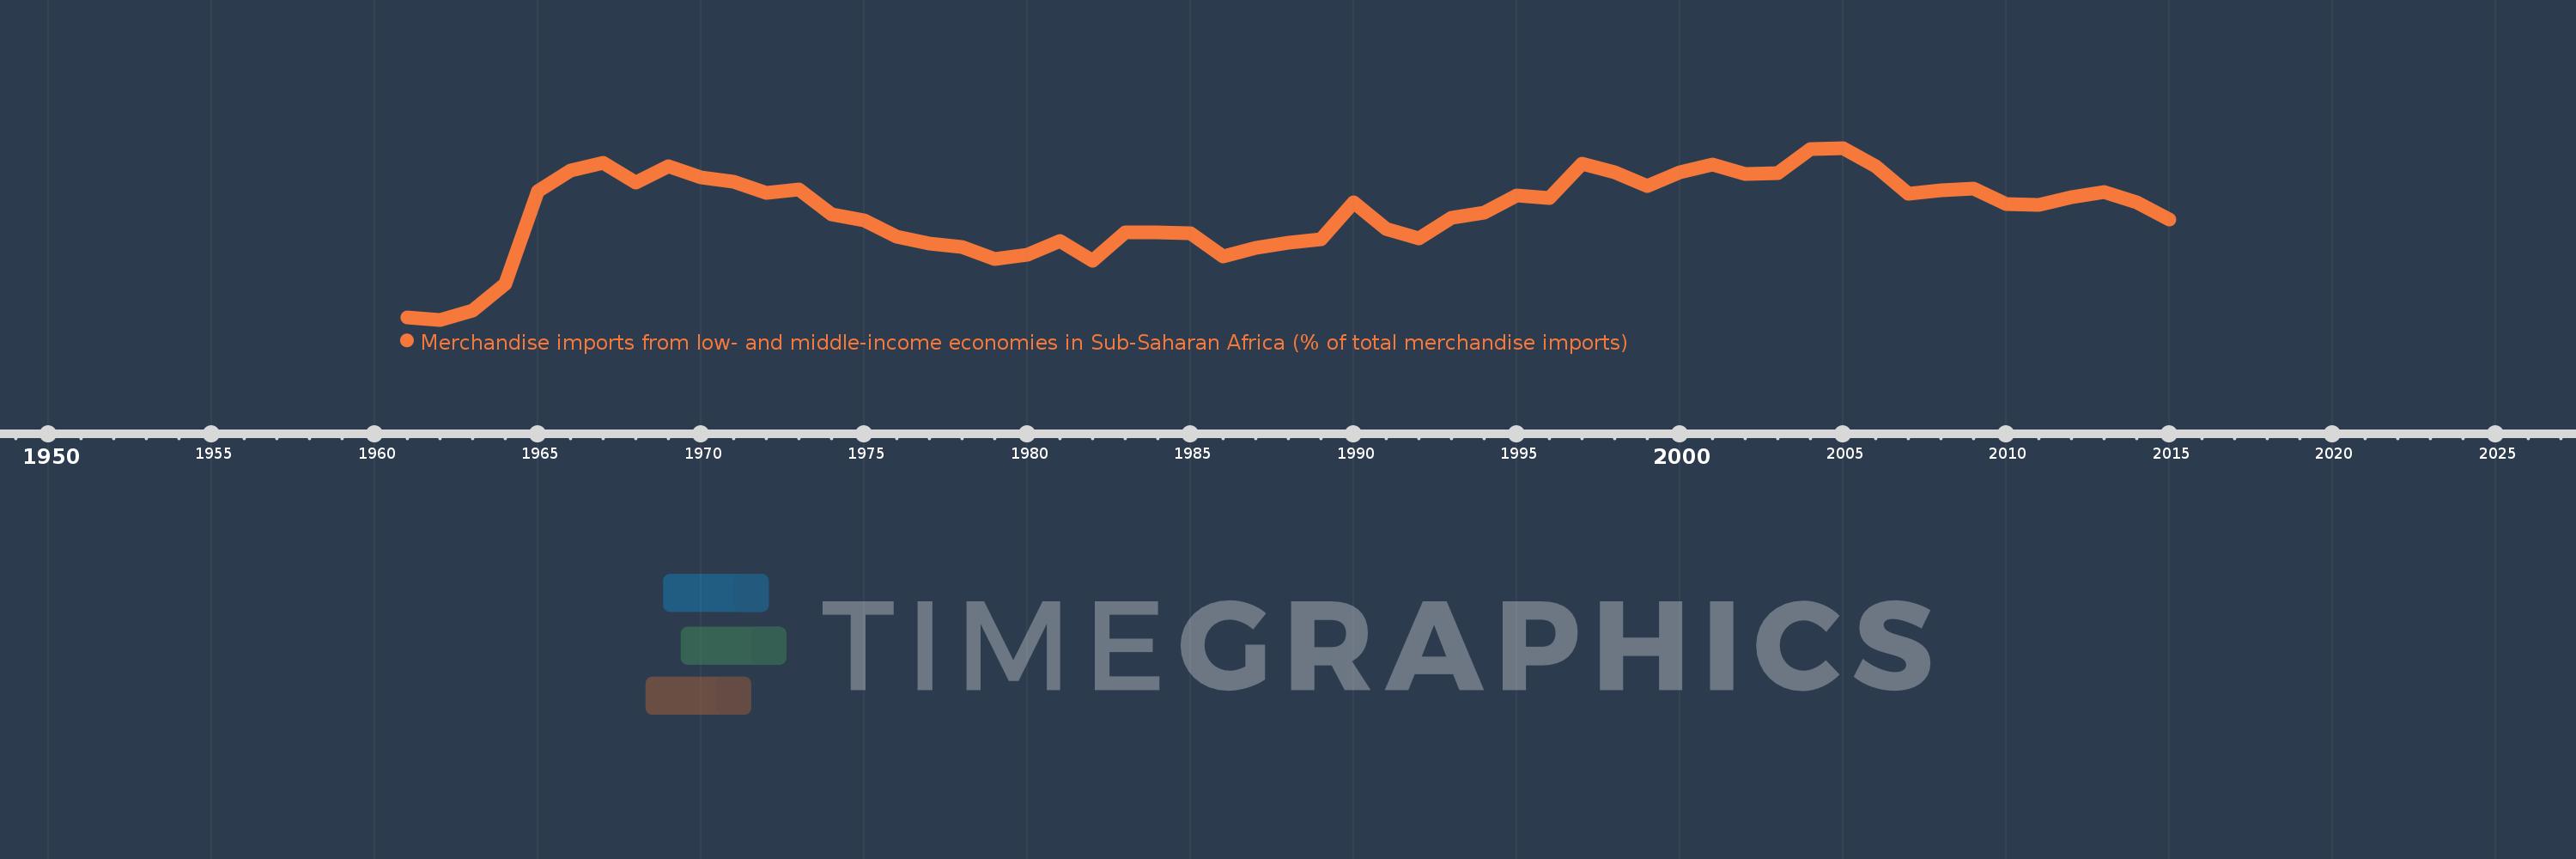
Merchandise imports from low- and middle-income economies in Sub-Saharan Africa (% of total merchandise imports)
2015,2014,2013,2012,2011,2010,2009,2008,2007,2006,2005,2004,2003,2002,2001,2000,1999,1998,1997,1996,1995,1994,1993,1992,1991,1990,1989,1988,1987,1986,1985,1984,1983,1982,1981,1980,1979,1978,1977,1976,1975,1974,1973,1972,1971,1970,1969,1968,1967,1966,1965,1964,1963,1962,1961
This statistics in other country:
AlbaniaAlgeriaAngolaArab WorldArgentinaArmeniaArubaAustraliaAustriaAzerbaijanBahamas, TheBahrainBangladeshBarbadosBelarusBelgiumBelizeBeninBermudaBoliviaBrazilBrunei DarussalamBulgariaBurkina FasoBurundiCabo VerdeCambodiaCameroonCanadaCaribbean small statesCentral African RepublicCentral Europe and the BalticsChadChileChinaColombiaCongo, Dem. Rep.Congo, Rep.Costa RicaCote d'IvoireCroatiaCubaCyprusCzech RepublicDenmarkDjiboutiDominicaDominican RepublicEarly-demographic dividendEast Asia & PacificEast Asia & Pacific (excluding high income)East Asia & Pacific (IDA & IBRD countries)EcuadorEgypt, Arab Rep.El SalvadorEstoniaEthiopiaEuro areaEurope & Central AsiaEurope & Central Asia (excluding high income)Europe & Central Asia (IDA & IBRD countries)European UnionFijiFinlandFragile and conflict affected situationsFranceGabonGambia, TheGeorgiaGermanyGhanaGreeceGreenlandGrenadaGuatemalaGuineaGuinea-BissauGuyanaHaitiHeavily indebted poor countries (HIPC)High incomeHondurasHong Kong SAR, ChinaHungaryIBRD onlyIcelandIDA & IBRD totalIDA blendIDA onlyIDA totalIndiaIndonesiaIran, Islamic Rep.IraqIrelandIsraelItalyJamaicaJapanJordanKazakhstanKenyaKorea, Dem. People’s Rep.Korea, Rep.KuwaitLao PDRLate-demographic dividendLatin America & Caribbean Latin America & Caribbean (excluding high income)Latin America & the Caribbean (IDA & IBRD countries)LatviaLeast developed countries: UN classificationLebanonLiberiaLibyaLithuaniaLow & middle incomeLow incomeLower middle incomeLuxembourgMacao SAR, ChinaMacedonia, FYRMadagascarMalawiMalaysiaMaliMaltaMauritaniaMauritiusMexicoMiddle East & North AfricaMiddle East & North Africa (excluding high income)Middle East & North Africa (IDA & IBRD countries)Middle incomeMoldovaMontenegroMoroccoMozambiqueMyanmarNetherlandsNew CaledoniaNew ZealandNicaraguaNigerNigeriaNorth AmericaNorwayOECD membersOmanOther small statesPacific island small statesPakistanPanamaPapua New GuineaParaguayPeruPhilippinesPolandPortugalPost-demographic dividendPre-demographic dividendQatarRomaniaRussian FederationRwandaSaudi ArabiaSenegalSerbiaSeychellesSierra LeoneSingaporeSlovak RepublicSloveniaSmall statesSomaliaSouth AfricaSouth AsiaSouth Asia (IDA & IBRD)SpainSri LankaSt. LuciaSt. Vincent and the GrenadinesSub-Saharan Africa Sub-Saharan Africa (excluding high income)Sub-Saharan Africa (IDA & IBRD countries)SudanSurinameSwedenSwitzerlandSyrian Arab RepublicTanzaniaThailandTogoTrinidad and TobagoTunisiaTurkeyUgandaUkraineUnited Arab EmiratesUnited KingdomUnited StatesUpper middle incomeUruguayVenezuela, RBVietnamWorldYemen, Rep.ZambiaZimbabwe Timeline:
This timeline shows a graph from 1961 to 2015 of Least developed countries: UN classification. No data until 1960. Number of actual observations by date: 55.
Source name:
World Development Indicators
Source organization:
World Bank staff estimates based data from International Monetary Fund's Direction of Trade database.
Categories, topics:
Private Sector, Trade
Last updated:
apr 23, 2017
Indicators value changes by year
Maximum:
11.859
jan 1, 2005
At the date of observation
Value
Absolute change
Change from previous value
jan 1, 1961
3.333
+3.333
0.0%
jan 1, 1962
3.211
-0.122
-3.66%
jan 1, 1963
3.653
+0.442
13.76%
jan 1, 1964
5.024
+1.371
37.54%
jan 1, 1965
9.696
+4.672
92.99%
jan 1, 1966
10.742
+1.046
10.79%
jan 1, 1967
11.114
+0.372
3.46%
jan 1, 1968
10.103
-1.011
-9.1%
jan 1, 1969
10.924
+0.821
8.13%
jan 1, 1970
10.376
-0.548
-5.02%
jan 1, 1971
10.15
-0.226
-2.18%
jan 1, 1972
9.582
-0.568
-5.6%
jan 1, 1973
9.788
+0.207
2.16%
jan 1, 1974
8.516
-1.272
-13.0%
jan 1, 1975
8.213
-0.303
-3.55%
jan 1, 1976
7.376
-0.837
-10.19%
jan 1, 1977
7.042
-0.334
-4.53%
jan 1, 1978
6.875
-0.167
-2.38%
jan 1, 1979
6.284
-0.59
-8.59%
jan 1, 1980
6.471
+0.186
2.96%
jan 1, 1981
7.191
+0.72
11.13%
jan 1, 1982
6.178
-1.013
-14.08%
jan 1, 1983
7.614
+1.436
23.24%
jan 1, 1984
7.62
+0.006
0.08%
jan 1, 1985
7.546
-0.074
-0.97%
jan 1, 1986
6.378
-1.168
-15.47%
jan 1, 1987
6.844
+0.465
7.3%
jan 1, 1988
7.105
+0.261
3.82%
jan 1, 1989
7.276
+0.171
2.41%
jan 1, 1990
9.116
+1.84
25.28%
jan 1, 1991
7.773
-1.343
-14.73%
jan 1, 1992
7.298
-0.475
-6.11%
jan 1, 1993
8.343
+1.045
14.32%
jan 1, 1994
8.617
+0.274
3.29%
jan 1, 1995
9.478
+0.861
9.99%
jan 1, 1996
9.328
-0.15
-1.58%
jan 1, 1997
11.08
+1.752
18.78%
jan 1, 1998
10.623
-0.458
-4.13%
jan 1, 1999
9.954
-0.668
-6.29%
jan 1, 2000
10.656
+0.702
7.05%
jan 1, 2001
11.005
+0.348
3.27%
jan 1, 2002
10.535
-0.469
-4.26%
jan 1, 2003
10.578
+0.043
0.41%
jan 1, 2004
11.797
+1.219
11.52%
jan 1, 2005
11.859
+0.061
0.52%
jan 1, 2006
10.941
-0.917
-7.74%
jan 1, 2007
9.544
-1.397
-12.77%
jan 1, 2008
9.713
+0.169
1.77%
jan 1, 2009
9.821
+0.108
1.12%
jan 1, 2010
9.048
-0.773
-7.87%
jan 1, 2011
9.013
-0.035
-0.39%
jan 1, 2012
9.39
+0.377
4.19%
jan 1, 2013
9.645
+0.254
2.71%
jan 1, 2014
9.137
-0.508
-5.26%
jan 1, 2015
8.269
-0.868
-9.5%
Ranking of countries by current statistics by years


Comments: