29
/
en
AIzaSyAYiBZKx7MnpbEhh9jyipgxe19OcubqV5w
April 1, 2024
91448
Brazil
BRA
true
2
1
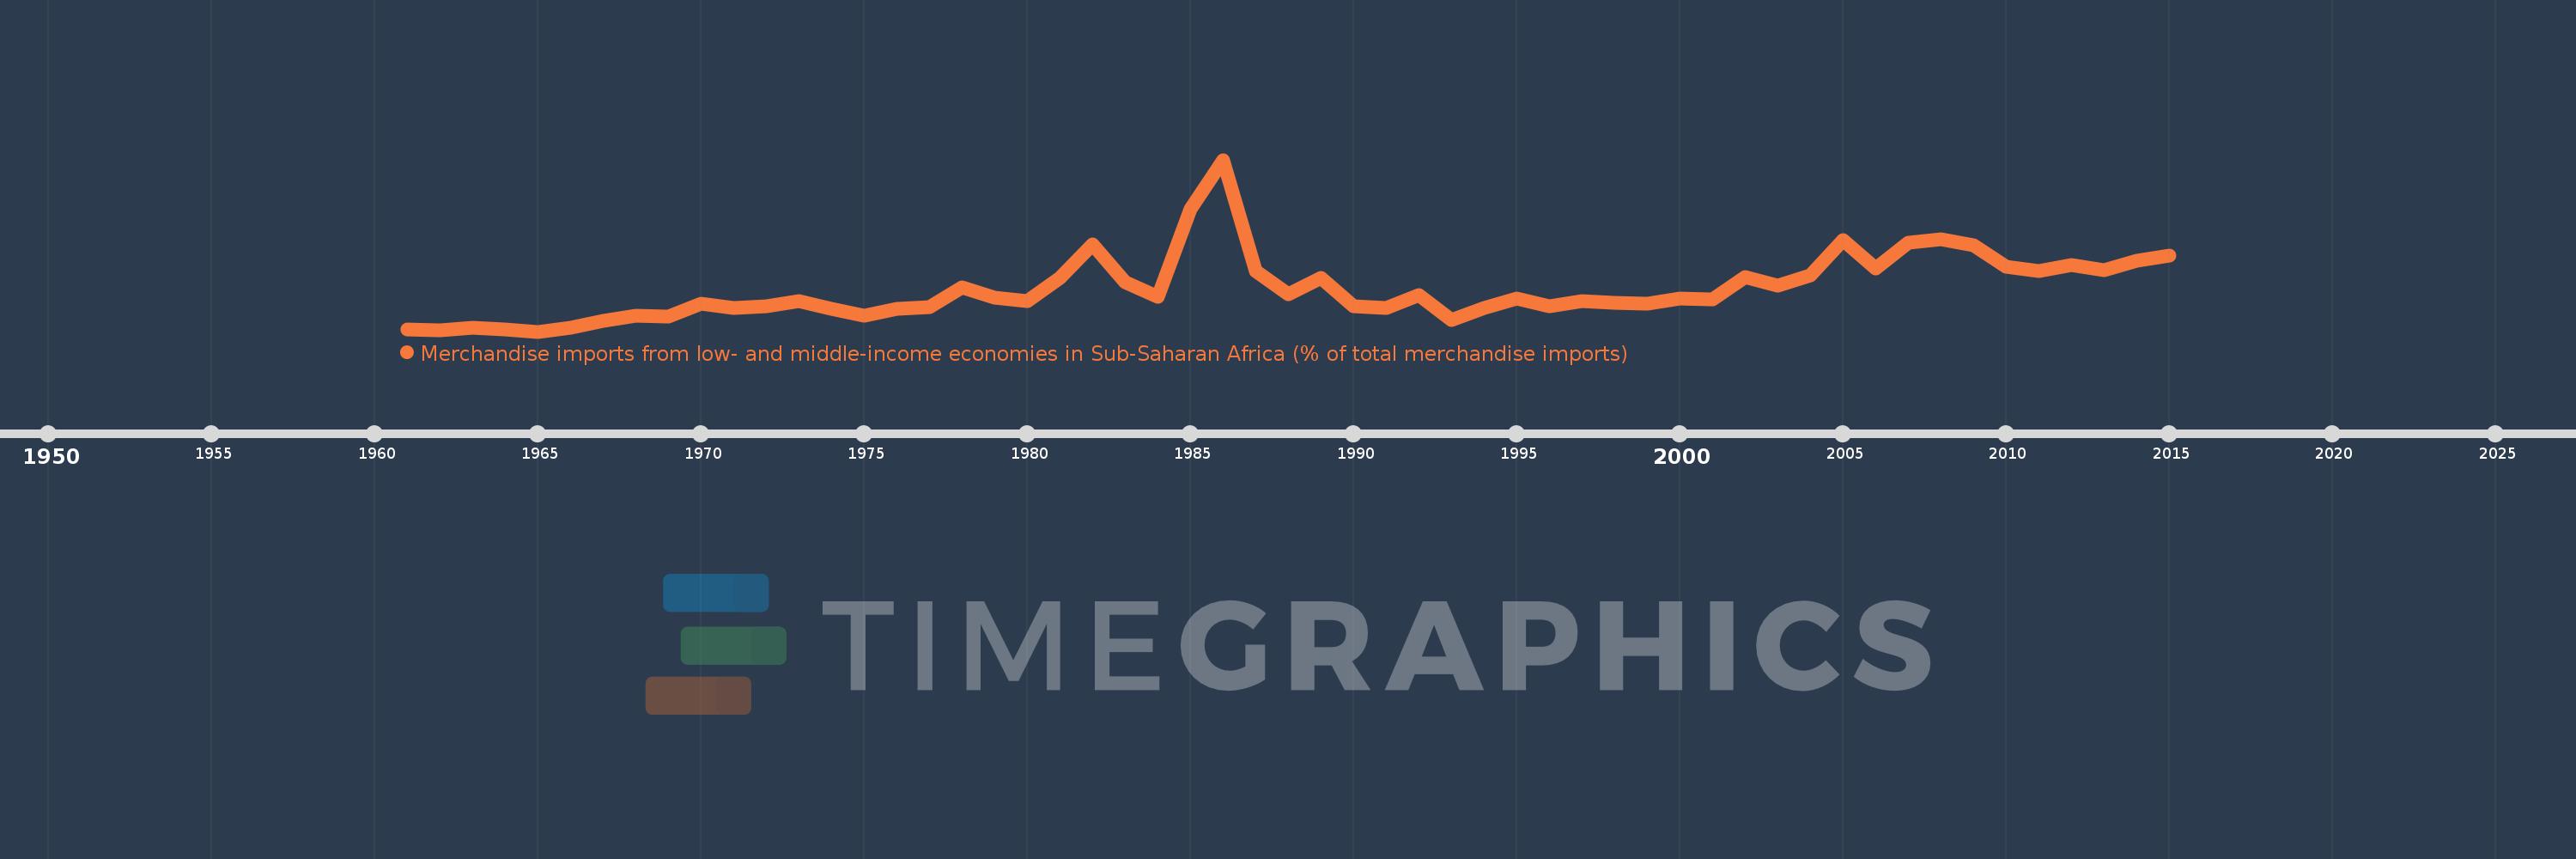
Merchandise imports from low- and middle-income economies in Sub-Saharan Africa (% of total merchandise imports)
2015,2014,2013,2012,2011,2010,2009,2008,2007,2006,2005,2004,2003,2002,2001,2000,1999,1998,1997,1996,1995,1994,1993,1992,1991,1990,1989,1988,1987,1986,1985,1984,1983,1982,1981,1980,1979,1978,1977,1976,1975,1974,1973,1972,1971,1970,1969,1968,1967,1966,1965,1964,1963,1962,1961
This statistics in other country:
AlbaniaAlgeriaAngolaArab WorldArgentinaArmeniaArubaAustraliaAustriaAzerbaijanBahamas, TheBahrainBangladeshBarbadosBelarusBelgiumBelizeBeninBermudaBoliviaBrazilBrunei DarussalamBulgariaBurkina FasoBurundiCabo VerdeCambodiaCameroonCanadaCaribbean small statesCentral African RepublicCentral Europe and the BalticsChadChileChinaColombiaCongo, Dem. Rep.Congo, Rep.Costa RicaCote d'IvoireCroatiaCubaCyprusCzech RepublicDenmarkDjiboutiDominicaDominican RepublicEarly-demographic dividendEast Asia & PacificEast Asia & Pacific (excluding high income)East Asia & Pacific (IDA & IBRD countries)EcuadorEgypt, Arab Rep.El SalvadorEstoniaEthiopiaEuro areaEurope & Central AsiaEurope & Central Asia (excluding high income)Europe & Central Asia (IDA & IBRD countries)European UnionFijiFinlandFragile and conflict affected situationsFranceGabonGambia, TheGeorgiaGermanyGhanaGreeceGreenlandGrenadaGuatemalaGuineaGuinea-BissauGuyanaHaitiHeavily indebted poor countries (HIPC)High incomeHondurasHong Kong SAR, ChinaHungaryIBRD onlyIcelandIDA & IBRD totalIDA blendIDA onlyIDA totalIndiaIndonesiaIran, Islamic Rep.IraqIrelandIsraelItalyJamaicaJapanJordanKazakhstanKenyaKorea, Dem. People’s Rep.Korea, Rep.KuwaitLao PDRLate-demographic dividendLatin America & Caribbean Latin America & Caribbean (excluding high income)Latin America & the Caribbean (IDA & IBRD countries)LatviaLeast developed countries: UN classificationLebanonLiberiaLibyaLithuaniaLow & middle incomeLow incomeLower middle incomeLuxembourgMacao SAR, ChinaMacedonia, FYRMadagascarMalawiMalaysiaMaliMaltaMauritaniaMauritiusMexicoMiddle East & North AfricaMiddle East & North Africa (excluding high income)Middle East & North Africa (IDA & IBRD countries)Middle incomeMoldovaMontenegroMoroccoMozambiqueMyanmarNetherlandsNew CaledoniaNew ZealandNicaraguaNigerNigeriaNorth AmericaNorwayOECD membersOmanOther small statesPacific island small statesPakistanPanamaPapua New GuineaParaguayPeruPhilippinesPolandPortugalPost-demographic dividendPre-demographic dividendQatarRomaniaRussian FederationRwandaSaudi ArabiaSenegalSerbiaSeychellesSierra LeoneSingaporeSlovak RepublicSloveniaSmall statesSomaliaSouth AfricaSouth AsiaSouth Asia (IDA & IBRD)SpainSri LankaSt. LuciaSt. Vincent and the GrenadinesSub-Saharan Africa Sub-Saharan Africa (excluding high income)Sub-Saharan Africa (IDA & IBRD countries)SudanSurinameSwedenSwitzerlandSyrian Arab RepublicTanzaniaThailandTogoTrinidad and TobagoTunisiaTurkeyUgandaUkraineUnited Arab EmiratesUnited KingdomUnited StatesUpper middle incomeUruguayVenezuela, RBVietnamWorldYemen, Rep.ZambiaZimbabwe Timeline:
This timeline shows a graph from 1961 to 2015 of Brazil. No data until 1960. Number of actual observations by date: 55.
Source name:
World Development Indicators
Source organization:
World Bank staff estimates based data from International Monetary Fund's Direction of Trade database.
Categories, topics:
Private Sector, Trade
Last updated:
apr 23, 2017
Indicators value changes by year
Maximum:
11.343
jan 1, 1986
At the date of observation
Value
Absolute change
Change from previous value
jan 1, 1961
0.201
+0.201
0.0%
jan 1, 1962
0.166
-0.035
-17.58%
jan 1, 1963
0.335
+0.169
101.98%
jan 1, 1964
0.203
-0.131
-39.24%
jan 1, 1965
0.071
-0.132
-64.89%
jan 1, 1966
0.347
+0.275
385.67%
jan 1, 1967
0.748
+0.401
115.81%
jan 1, 1968
1.126
+0.377
50.45%
jan 1, 1969
1.068
-0.057
-5.09%
jan 1, 1970
1.901
+0.833
77.95%
jan 1, 1971
1.593
-0.308
-16.19%
jan 1, 1972
1.715
+0.122
7.64%
jan 1, 1973
2.051
+0.335
19.56%
jan 1, 1974
1.543
-0.508
-24.76%
jan 1, 1975
1.115
-0.428
-27.73%
jan 1, 1976
1.565
+0.45
40.38%
jan 1, 1977
1.705
+0.14
8.93%
jan 1, 1978
2.96
+1.255
73.61%
jan 1, 1979
2.306
-0.654
-22.1%
jan 1, 1980
2.052
-0.254
-11.01%
jan 1, 1981
3.572
+1.52
74.07%
jan 1, 1982
5.786
+2.214
61.99%
jan 1, 1983
3.292
-2.494
-43.11%
jan 1, 1984
2.38
-0.912
-27.69%
jan 1, 1985
8.094
+5.714
240.03%
jan 1, 1986
11.343
+3.249
40.14%
jan 1, 1987
4.031
-7.312
-64.46%
jan 1, 1988
2.505
-1.526
-37.85%
jan 1, 1989
3.612
+1.107
44.17%
jan 1, 1990
1.753
-1.859
-51.46%
jan 1, 1991
1.597
-0.156
-8.88%
jan 1, 1992
2.482
+0.884
55.36%
jan 1, 1993
0.838
-1.643
-66.22%
jan 1, 1994
1.609
+0.771
91.97%
jan 1, 1995
2.258
+0.648
40.29%
jan 1, 1996
1.72
-0.538
-23.81%
jan 1, 1997
2.078
+0.358
20.79%
jan 1, 1998
1.967
-0.11
-5.32%
jan 1, 1999
1.91
-0.058
-2.93%
jan 1, 2000
2.26
+0.351
18.36%
jan 1, 2001
2.173
-0.087
-3.86%
jan 1, 2002
3.64
+1.467
67.51%
jan 1, 2003
3.086
-0.555
-15.24%
jan 1, 2004
3.785
+0.7
22.68%
jan 1, 2005
6.076
+2.29
60.5%
jan 1, 2006
4.225
-1.851
-30.47%
jan 1, 2007
5.877
+1.653
39.12%
jan 1, 2008
6.129
+0.252
4.29%
jan 1, 2009
5.722
-0.407
-6.64%
jan 1, 2010
4.327
-1.395
-24.38%
jan 1, 2011
4.058
-0.269
-6.22%
jan 1, 2012
4.449
+0.391
9.64%
jan 1, 2013
4.128
-0.321
-7.22%
jan 1, 2014
4.724
+0.597
14.46%
jan 1, 2015
5.051
+0.327
6.92%
Ranking of countries by current statistics by years


Comments: