29
/
en
AIzaSyAYiBZKx7MnpbEhh9jyipgxe19OcubqV5w
April 1, 2024
253298
Sudan
SDN
true
2
1
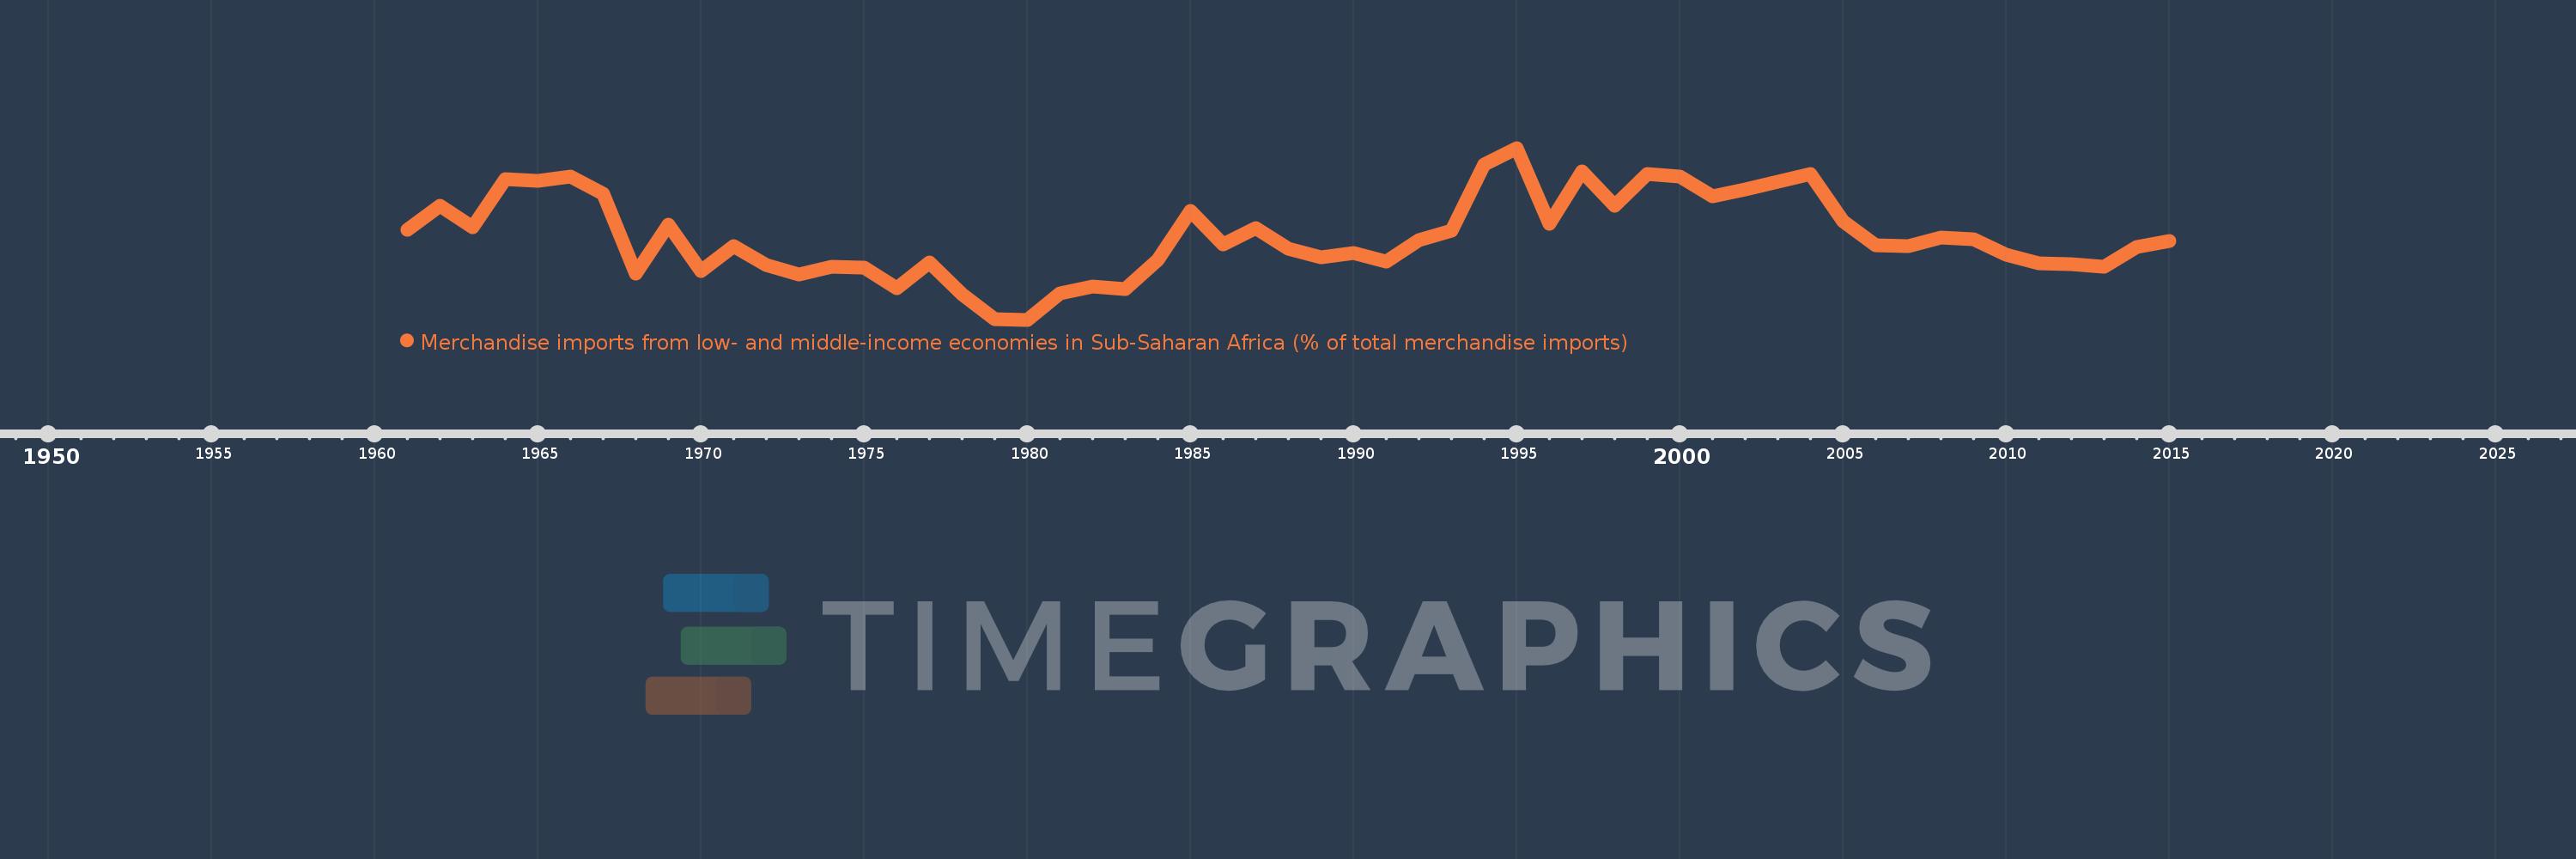
Merchandise imports from low- and middle-income economies in Sub-Saharan Africa (% of total merchandise imports)
2015,2014,2013,2012,2011,2010,2009,2008,2007,2006,2005,2004,2003,2002,2001,2000,1999,1998,1997,1996,1995,1994,1993,1992,1991,1990,1989,1988,1987,1986,1985,1984,1983,1982,1981,1980,1979,1978,1977,1976,1975,1974,1973,1972,1971,1970,1969,1968,1967,1966,1965,1964,1963,1962,1961
This statistics in other country:
AlbaniaAlgeriaAngolaArab WorldArgentinaArmeniaArubaAustraliaAustriaAzerbaijanBahamas, TheBahrainBangladeshBarbadosBelarusBelgiumBelizeBeninBermudaBoliviaBrazilBrunei DarussalamBulgariaBurkina FasoBurundiCabo VerdeCambodiaCameroonCanadaCaribbean small statesCentral African RepublicCentral Europe and the BalticsChadChileChinaColombiaCongo, Dem. Rep.Congo, Rep.Costa RicaCote d'IvoireCroatiaCubaCyprusCzech RepublicDenmarkDjiboutiDominicaDominican RepublicEarly-demographic dividendEast Asia & PacificEast Asia & Pacific (excluding high income)East Asia & Pacific (IDA & IBRD countries)EcuadorEgypt, Arab Rep.El SalvadorEstoniaEthiopiaEuro areaEurope & Central AsiaEurope & Central Asia (excluding high income)Europe & Central Asia (IDA & IBRD countries)European UnionFijiFinlandFragile and conflict affected situationsFranceGabonGambia, TheGeorgiaGermanyGhanaGreeceGreenlandGrenadaGuatemalaGuineaGuinea-BissauGuyanaHaitiHeavily indebted poor countries (HIPC)High incomeHondurasHong Kong SAR, ChinaHungaryIBRD onlyIcelandIDA & IBRD totalIDA blendIDA onlyIDA totalIndiaIndonesiaIran, Islamic Rep.IraqIrelandIsraelItalyJamaicaJapanJordanKazakhstanKenyaKorea, Dem. People’s Rep.Korea, Rep.KuwaitLao PDRLate-demographic dividendLatin America & Caribbean Latin America & Caribbean (excluding high income)Latin America & the Caribbean (IDA & IBRD countries)LatviaLeast developed countries: UN classificationLebanonLiberiaLibyaLithuaniaLow & middle incomeLow incomeLower middle incomeLuxembourgMacao SAR, ChinaMacedonia, FYRMadagascarMalawiMalaysiaMaliMaltaMauritaniaMauritiusMexicoMiddle East & North AfricaMiddle East & North Africa (excluding high income)Middle East & North Africa (IDA & IBRD countries)Middle incomeMoldovaMontenegroMoroccoMozambiqueMyanmarNetherlandsNew CaledoniaNew ZealandNicaraguaNigerNigeriaNorth AmericaNorwayOECD membersOmanOther small statesPacific island small statesPakistanPanamaPapua New GuineaParaguayPeruPhilippinesPolandPortugalPost-demographic dividendPre-demographic dividendQatarRomaniaRussian FederationRwandaSaudi ArabiaSenegalSerbiaSeychellesSierra LeoneSingaporeSlovak RepublicSloveniaSmall statesSomaliaSouth AfricaSouth AsiaSouth Asia (IDA & IBRD)SpainSri LankaSt. LuciaSt. Vincent and the GrenadinesSub-Saharan Africa Sub-Saharan Africa (excluding high income)Sub-Saharan Africa (IDA & IBRD countries)SudanSurinameSwedenSwitzerlandSyrian Arab RepublicTanzaniaThailandTogoTrinidad and TobagoTunisiaTurkeyUgandaUkraineUnited Arab EmiratesUnited KingdomUnited StatesUpper middle incomeUruguayVenezuela, RBVietnamWorldYemen, Rep.ZambiaZimbabwe Timeline:
This timeline shows a graph from 1961 to 2015 of Sudan. No data until 1960. Number of actual observations by date: 55.
Source name:
World Development Indicators
Source organization:
World Bank staff estimates based data from International Monetary Fund's Direction of Trade database.
Categories, topics:
Private Sector, Trade
Last updated:
apr 23, 2017
Indicators value changes by year
At the date of observation
Value
Absolute change
Change from previous value
jan 1, 1961
2.548
+2.548
0.0%
jan 1, 1962
3.229
+0.68
26.68%
jan 1, 1963
2.614
-0.614
-19.03%
jan 1, 1964
3.979
+1.365
52.21%
jan 1, 1965
3.917
-0.062
-1.57%
jan 1, 1966
4.04
+0.124
3.16%
jan 1, 1967
3.551
-0.49
-12.12%
jan 1, 1968
1.313
-2.237
-63.01%
jan 1, 1969
2.679
+1.365
103.95%
jan 1, 1970
1.372
-1.307
-48.78%
jan 1, 1971
2.083
+0.711
51.84%
jan 1, 1972
1.538
-0.545
-26.18%
jan 1, 1973
1.282
-0.256
-16.62%
jan 1, 1974
1.495
+0.213
16.62%
jan 1, 1975
1.475
-0.021
-1.39%
jan 1, 1976
0.895
-0.58
-39.34%
jan 1, 1977
1.618
+0.724
80.92%
jan 1, 1978
0.729
-0.89
-54.97%
jan 1, 1979
0.018
-0.711
-97.55%
jan 1, 1980
0.003
-0.014
-81.06%
jan 1, 1981
0.747
+0.743
22.02K%
jan 1, 1982
0.946
+0.199
26.7%
jan 1, 1983
0.877
-0.069
-7.32%
jan 1, 1984
1.691
+0.815
92.93%
jan 1, 1985
3.075
+1.384
81.83%
jan 1, 1986
2.121
-0.955
-31.05%
jan 1, 1987
2.593
+0.473
22.28%
jan 1, 1988
2.003
-0.59
-22.76%
jan 1, 1989
1.775
-0.228
-11.37%
jan 1, 1990
1.882
+0.107
6.02%
jan 1, 1991
1.644
-0.239
-12.68%
jan 1, 1992
2.239
+0.596
36.25%
jan 1, 1993
2.507
+0.267
11.94%
jan 1, 1994
4.386
+1.879
74.98%
jan 1, 1995
4.851
+0.465
10.6%
jan 1, 1996
2.72
-2.131
-43.93%
jan 1, 1997
4.192
+1.472
54.11%
jan 1, 1998
3.211
-0.981
-23.39%
jan 1, 1999
4.114
+0.903
28.11%
jan 1, 2000
4.045
-0.07
-1.69%
jan 1, 2001
3.491
-0.554
-13.7%
jan 1, 2002
3.676
+0.186
5.32%
jan 1, 2003
3.899
+0.223
6.06%
jan 1, 2004
4.114
+0.215
5.52%
jan 1, 2005
2.78
-1.334
-32.43%
jan 1, 2006
2.108
-0.672
-24.16%
jan 1, 2007
2.071
-0.038
-1.79%
jan 1, 2008
2.33
+0.259
12.52%
jan 1, 2009
2.284
-0.046
-1.97%
jan 1, 2010
1.848
-0.436
-19.09%
jan 1, 2011
1.596
-0.251
-13.61%
jan 1, 2012
1.572
-0.025
-1.56%
jan 1, 2013
1.51
-0.061
-3.9%
jan 1, 2014
2.062
+0.552
36.53%
jan 1, 2015
2.23
+0.168
8.16%
Ranking of countries by current statistics by years


Comments: