29
/
en
AIzaSyAYiBZKx7MnpbEhh9jyipgxe19OcubqV5w
April 1, 2024
33647
European Union
EUU
false
2
1
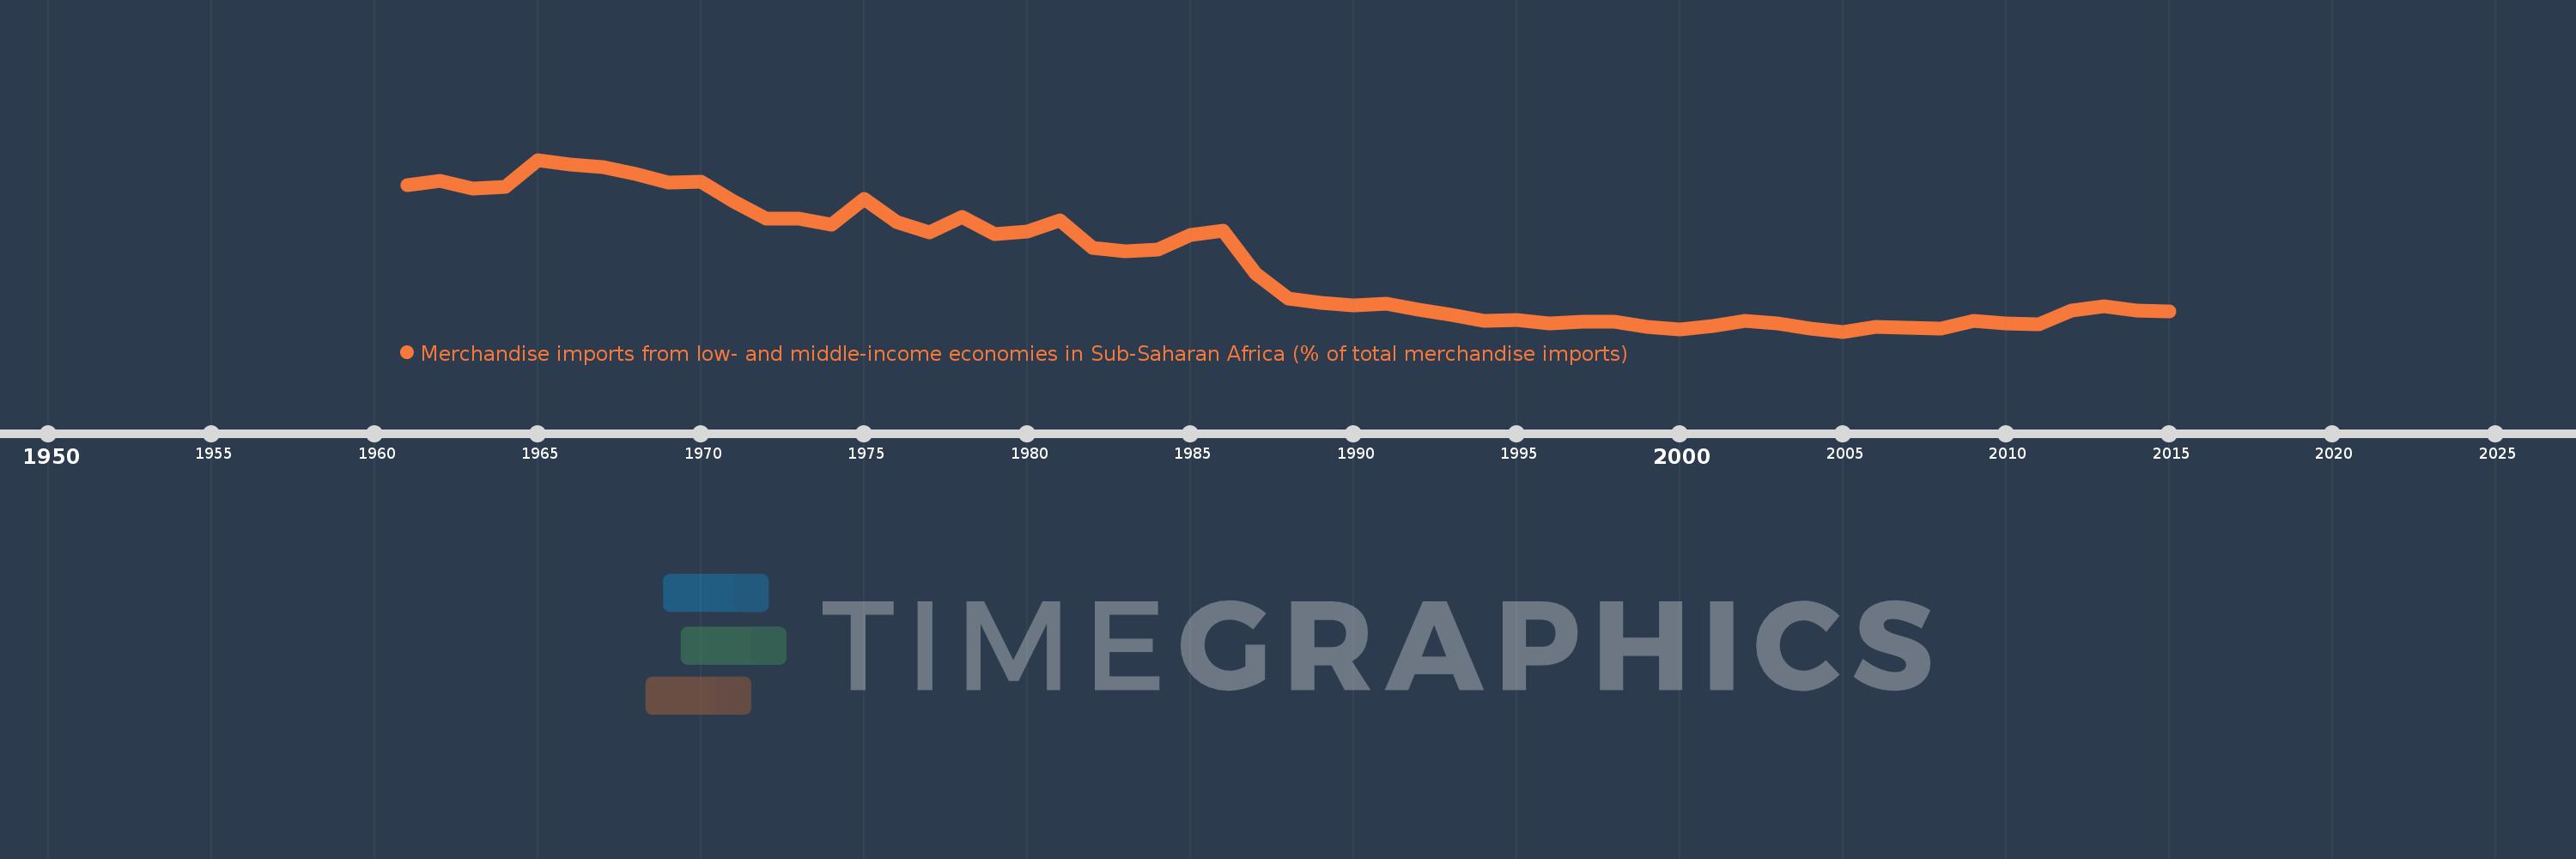
Merchandise imports from low- and middle-income economies in Sub-Saharan Africa (% of total merchandise imports)
2015,2014,2013,2012,2011,2010,2009,2008,2007,2006,2005,2004,2003,2002,2001,2000,1999,1998,1997,1996,1995,1994,1993,1992,1991,1990,1989,1988,1987,1986,1985,1984,1983,1982,1981,1980,1979,1978,1977,1976,1975,1974,1973,1972,1971,1970,1969,1968,1967,1966,1965,1964,1963,1962,1961
This statistics in other country:
AlbaniaAlgeriaAngolaArab WorldArgentinaArmeniaArubaAustraliaAustriaAzerbaijanBahamas, TheBahrainBangladeshBarbadosBelarusBelgiumBelizeBeninBermudaBoliviaBrazilBrunei DarussalamBulgariaBurkina FasoBurundiCabo VerdeCambodiaCameroonCanadaCaribbean small statesCentral African RepublicCentral Europe and the BalticsChadChileChinaColombiaCongo, Dem. Rep.Congo, Rep.Costa RicaCote d'IvoireCroatiaCubaCyprusCzech RepublicDenmarkDjiboutiDominicaDominican RepublicEarly-demographic dividendEast Asia & PacificEast Asia & Pacific (excluding high income)East Asia & Pacific (IDA & IBRD countries)EcuadorEgypt, Arab Rep.El SalvadorEstoniaEthiopiaEuro areaEurope & Central AsiaEurope & Central Asia (excluding high income)Europe & Central Asia (IDA & IBRD countries)European UnionFijiFinlandFragile and conflict affected situationsFranceGabonGambia, TheGeorgiaGermanyGhanaGreeceGreenlandGrenadaGuatemalaGuineaGuinea-BissauGuyanaHaitiHeavily indebted poor countries (HIPC)High incomeHondurasHong Kong SAR, ChinaHungaryIBRD onlyIcelandIDA & IBRD totalIDA blendIDA onlyIDA totalIndiaIndonesiaIran, Islamic Rep.IraqIrelandIsraelItalyJamaicaJapanJordanKazakhstanKenyaKorea, Dem. People’s Rep.Korea, Rep.KuwaitLao PDRLate-demographic dividendLatin America & Caribbean Latin America & Caribbean (excluding high income)Latin America & the Caribbean (IDA & IBRD countries)LatviaLeast developed countries: UN classificationLebanonLiberiaLibyaLithuaniaLow & middle incomeLow incomeLower middle incomeLuxembourgMacao SAR, ChinaMacedonia, FYRMadagascarMalawiMalaysiaMaliMaltaMauritaniaMauritiusMexicoMiddle East & North AfricaMiddle East & North Africa (excluding high income)Middle East & North Africa (IDA & IBRD countries)Middle incomeMoldovaMontenegroMoroccoMozambiqueMyanmarNetherlandsNew CaledoniaNew ZealandNicaraguaNigerNigeriaNorth AmericaNorwayOECD membersOmanOther small statesPacific island small statesPakistanPanamaPapua New GuineaParaguayPeruPhilippinesPolandPortugalPost-demographic dividendPre-demographic dividendQatarRomaniaRussian FederationRwandaSaudi ArabiaSenegalSerbiaSeychellesSierra LeoneSingaporeSlovak RepublicSloveniaSmall statesSomaliaSouth AfricaSouth AsiaSouth Asia (IDA & IBRD)SpainSri LankaSt. LuciaSt. Vincent and the GrenadinesSub-Saharan Africa Sub-Saharan Africa (excluding high income)Sub-Saharan Africa (IDA & IBRD countries)SudanSurinameSwedenSwitzerlandSyrian Arab RepublicTanzaniaThailandTogoTrinidad and TobagoTunisiaTurkeyUgandaUkraineUnited Arab EmiratesUnited KingdomUnited StatesUpper middle incomeUruguayVenezuela, RBVietnamWorldYemen, Rep.ZambiaZimbabwe Timeline:
This timeline shows a graph from 1961 to 2015 of European Union. No data until 1960. Number of actual observations by date: 55.
Source name:
World Development Indicators
Source organization:
World Bank staff estimates based data from International Monetary Fund's Direction of Trade database.
Categories, topics:
Private Sector, Trade
Last updated:
apr 23, 2017
Indicators value changes by year
At the date of observation
Value
Absolute change
Change from previous value
jan 1, 1961
4.82
+4.82
0.0%
jan 1, 1962
4.914
+0.094
1.95%
jan 1, 1963
4.734
-0.18
-3.66%
jan 1, 1964
4.774
+0.04
0.85%
jan 1, 1965
5.416
+0.642
13.44%
jan 1, 1966
5.303
-0.113
-2.08%
jan 1, 1967
5.25
-0.053
-1.01%
jan 1, 1968
5.074
-0.176
-3.36%
jan 1, 1969
4.874
-0.199
-3.93%
jan 1, 1970
4.898
+0.023
0.48%
jan 1, 1971
4.416
-0.482
-9.84%
jan 1, 1972
4.005
-0.41
-9.29%
jan 1, 1973
4.003
-0.003
-0.07%
jan 1, 1974
3.864
-0.139
-3.46%
jan 1, 1975
4.484
+0.62
16.05%
jan 1, 1976
3.926
-0.558
-12.45%
jan 1, 1977
3.678
-0.248
-6.31%
jan 1, 1978
4.052
+0.373
10.15%
jan 1, 1979
3.638
-0.414
-10.21%
jan 1, 1980
3.699
+0.061
1.67%
jan 1, 1981
3.971
+0.272
7.36%
jan 1, 1982
3.322
-0.649
-16.34%
jan 1, 1983
3.242
-0.08
-2.41%
jan 1, 1984
3.271
+0.029
0.89%
jan 1, 1985
3.615
+0.344
10.51%
jan 1, 1986
3.723
+0.108
2.99%
jan 1, 1987
2.694
-1.028
-27.62%
jan 1, 1988
2.105
-0.589
-21.86%
jan 1, 1989
2.001
-0.104
-4.96%
jan 1, 1990
1.94
-0.061
-3.05%
jan 1, 1991
1.976
+0.036
1.85%
jan 1, 1992
1.842
-0.134
-6.78%
jan 1, 1993
1.715
-0.127
-6.9%
jan 1, 1994
1.569
-0.146
-8.51%
jan 1, 1995
1.583
+0.014
0.89%
jan 1, 1996
1.505
-0.078
-4.95%
jan 1, 1997
1.554
+0.049
3.27%
jan 1, 1998
1.555
+0.001
0.1%
jan 1, 1999
1.427
-0.129
-8.27%
jan 1, 2000
1.358
-0.068
-4.8%
jan 1, 2001
1.442
+0.084
6.15%
jan 1, 2002
1.58
+0.138
9.57%
jan 1, 2003
1.52
-0.059
-3.76%
jan 1, 2004
1.391
-0.129
-8.48%
jan 1, 2005
1.316
-0.075
-5.43%
jan 1, 2006
1.426
+0.11
8.34%
jan 1, 2007
1.401
-0.024
-1.69%
jan 1, 2008
1.386
-0.015
-1.1%
jan 1, 2009
1.578
+0.192
13.83%
jan 1, 2010
1.509
-0.069
-4.39%
jan 1, 2011
1.483
-0.025
-1.66%
jan 1, 2012
1.81
+0.327
22.04%
jan 1, 2013
1.931
+0.121
6.68%
jan 1, 2014
1.827
-0.104
-5.41%
jan 1, 2015
1.803
-0.024
-1.3%
Ranking of countries by current statistics by years


Comments: