29
/
en
AIzaSyAYiBZKx7MnpbEhh9jyipgxe19OcubqV5w
April 1, 2024
133409
Finland
FIN
true
2
1
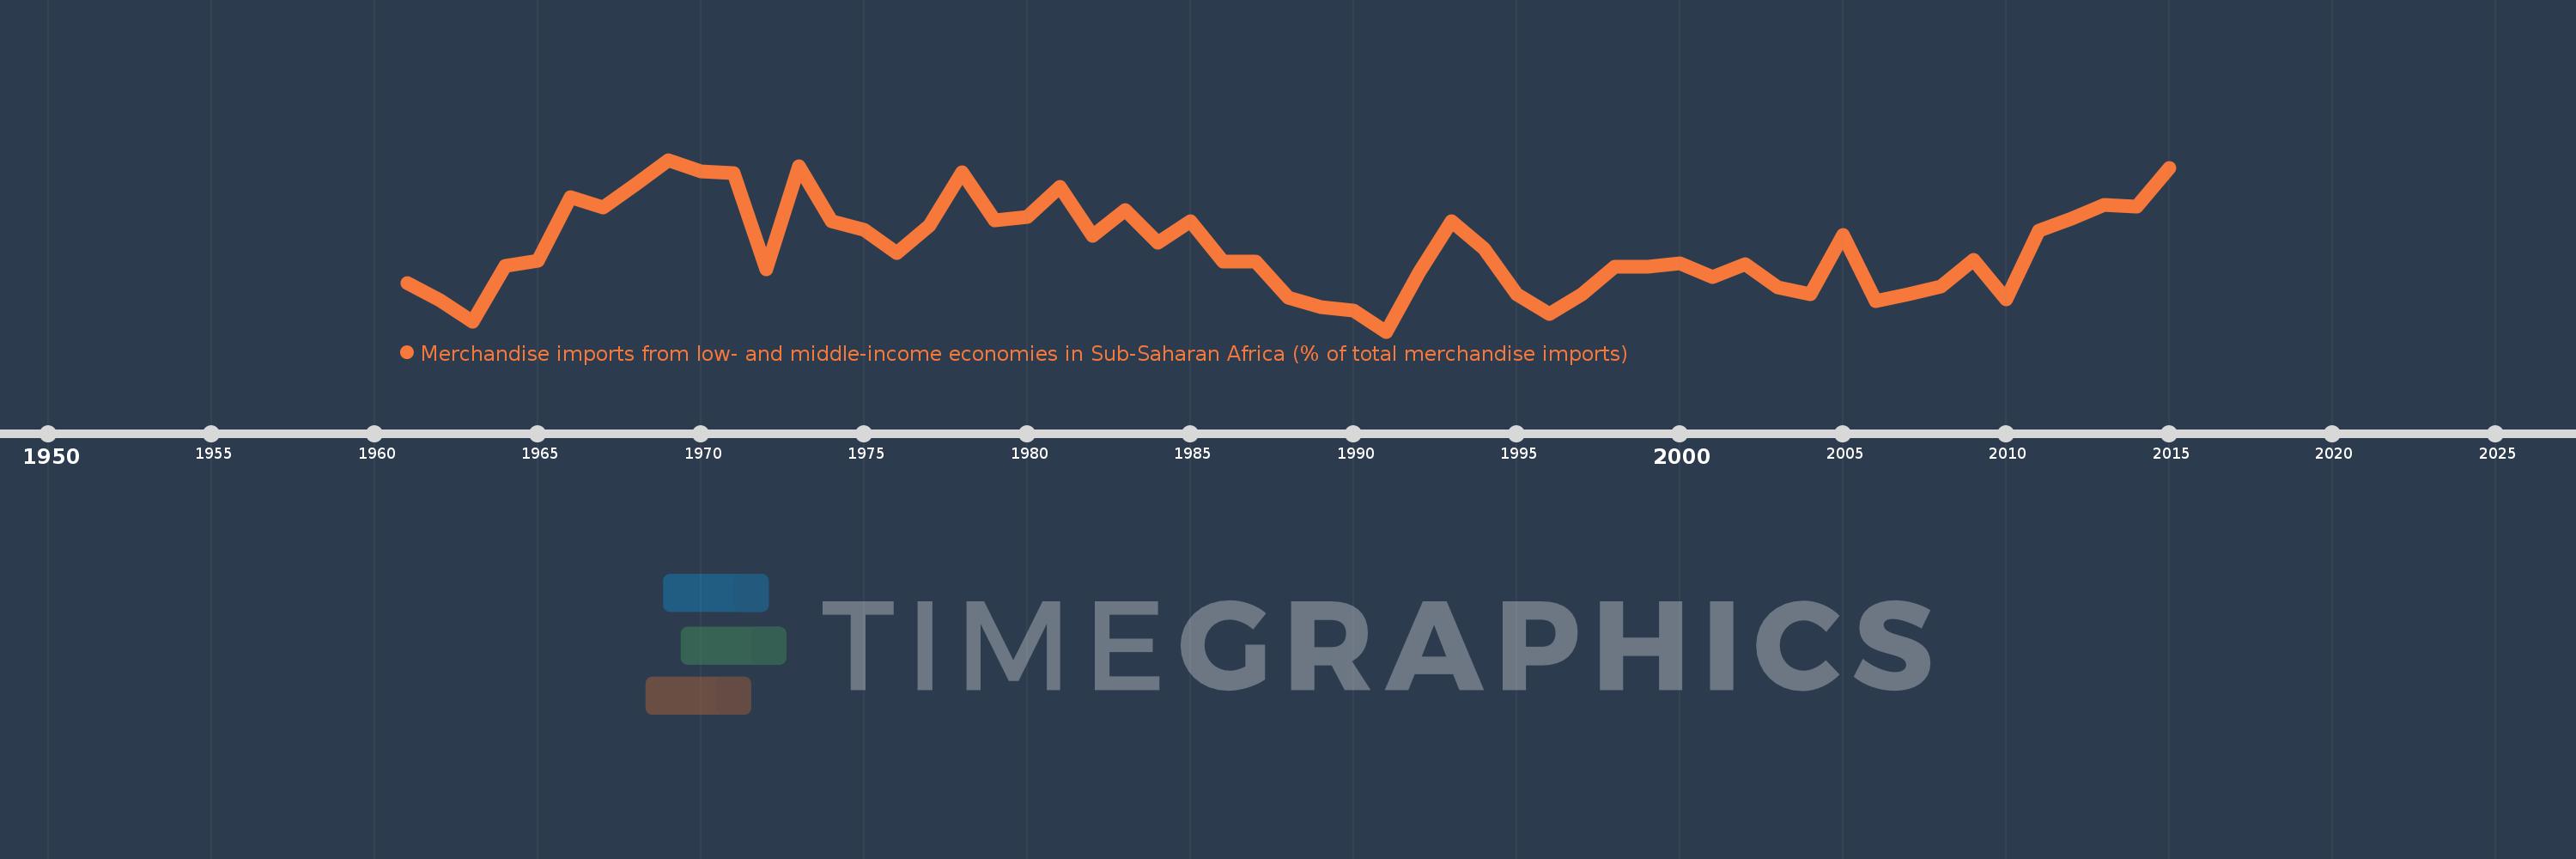
Merchandise imports from low- and middle-income economies in Sub-Saharan Africa (% of total merchandise imports)
2015,2014,2013,2012,2011,2010,2009,2008,2007,2006,2005,2004,2003,2002,2001,2000,1999,1998,1997,1996,1995,1994,1993,1992,1991,1990,1989,1988,1987,1986,1985,1984,1983,1982,1981,1980,1979,1978,1977,1976,1975,1974,1973,1972,1971,1970,1969,1968,1967,1966,1965,1964,1963,1962,1961
This statistics in other country:
AlbaniaAlgeriaAngolaArab WorldArgentinaArmeniaArubaAustraliaAustriaAzerbaijanBahamas, TheBahrainBangladeshBarbadosBelarusBelgiumBelizeBeninBermudaBoliviaBrazilBrunei DarussalamBulgariaBurkina FasoBurundiCabo VerdeCambodiaCameroonCanadaCaribbean small statesCentral African RepublicCentral Europe and the BalticsChadChileChinaColombiaCongo, Dem. Rep.Congo, Rep.Costa RicaCote d'IvoireCroatiaCubaCyprusCzech RepublicDenmarkDjiboutiDominicaDominican RepublicEarly-demographic dividendEast Asia & PacificEast Asia & Pacific (excluding high income)East Asia & Pacific (IDA & IBRD countries)EcuadorEgypt, Arab Rep.El SalvadorEstoniaEthiopiaEuro areaEurope & Central AsiaEurope & Central Asia (excluding high income)Europe & Central Asia (IDA & IBRD countries)European UnionFijiFinlandFragile and conflict affected situationsFranceGabonGambia, TheGeorgiaGermanyGhanaGreeceGreenlandGrenadaGuatemalaGuineaGuinea-BissauGuyanaHaitiHeavily indebted poor countries (HIPC)High incomeHondurasHong Kong SAR, ChinaHungaryIBRD onlyIcelandIDA & IBRD totalIDA blendIDA onlyIDA totalIndiaIndonesiaIran, Islamic Rep.IraqIrelandIsraelItalyJamaicaJapanJordanKazakhstanKenyaKorea, Dem. People’s Rep.Korea, Rep.KuwaitLao PDRLate-demographic dividendLatin America & Caribbean Latin America & Caribbean (excluding high income)Latin America & the Caribbean (IDA & IBRD countries)LatviaLeast developed countries: UN classificationLebanonLiberiaLibyaLithuaniaLow & middle incomeLow incomeLower middle incomeLuxembourgMacao SAR, ChinaMacedonia, FYRMadagascarMalawiMalaysiaMaliMaltaMauritaniaMauritiusMexicoMiddle East & North AfricaMiddle East & North Africa (excluding high income)Middle East & North Africa (IDA & IBRD countries)Middle incomeMoldovaMontenegroMoroccoMozambiqueMyanmarNetherlandsNew CaledoniaNew ZealandNicaraguaNigerNigeriaNorth AmericaNorwayOECD membersOmanOther small statesPacific island small statesPakistanPanamaPapua New GuineaParaguayPeruPhilippinesPolandPortugalPost-demographic dividendPre-demographic dividendQatarRomaniaRussian FederationRwandaSaudi ArabiaSenegalSerbiaSeychellesSierra LeoneSingaporeSlovak RepublicSloveniaSmall statesSomaliaSouth AfricaSouth AsiaSouth Asia (IDA & IBRD)SpainSri LankaSt. LuciaSt. Vincent and the GrenadinesSub-Saharan Africa Sub-Saharan Africa (excluding high income)Sub-Saharan Africa (IDA & IBRD countries)SudanSurinameSwedenSwitzerlandSyrian Arab RepublicTanzaniaThailandTogoTrinidad and TobagoTunisiaTurkeyUgandaUkraineUnited Arab EmiratesUnited KingdomUnited StatesUpper middle incomeUruguayVenezuela, RBVietnamWorldYemen, Rep.ZambiaZimbabwe Timeline:
This timeline shows a graph from 1961 to 2015 of Finland. No data until 1960. Number of actual observations by date: 55.
Source name:
World Development Indicators
Source organization:
World Bank staff estimates based data from International Monetary Fund's Direction of Trade database.
Categories, topics:
Private Sector, Trade
Last updated:
apr 23, 2017
Indicators value changes by year
At the date of observation
Value
Absolute change
Change from previous value
jan 1, 1961
0.484
+0.484
0.0%
jan 1, 1962
0.393
-0.091
-18.83%
jan 1, 1963
0.277
-0.116
-29.5%
jan 1, 1964
0.574
+0.297
107.26%
jan 1, 1965
0.601
+0.027
4.7%
jan 1, 1966
0.932
+0.331
55.07%
jan 1, 1967
0.88
-0.052
-5.55%
jan 1, 1968
1.002
+0.122
13.89%
jan 1, 1969
1.13
+0.128
12.76%
jan 1, 1970
1.069
-0.061
-5.44%
jan 1, 1971
1.062
-0.007
-0.65%
jan 1, 1972
0.554
-0.508
-47.8%
jan 1, 1973
1.095
+0.541
97.57%
jan 1, 1974
0.805
-0.29
-26.5%
jan 1, 1975
0.762
-0.043
-5.32%
jan 1, 1976
0.642
-0.12
-15.81%
jan 1, 1977
0.785
+0.143
22.36%
jan 1, 1978
1.066
+0.281
35.83%
jan 1, 1979
0.81
-0.256
-24.02%
jan 1, 1980
0.831
+0.02
2.52%
jan 1, 1981
0.99
+0.159
19.15%
jan 1, 1982
0.732
-0.257
-25.99%
jan 1, 1983
0.866
+0.134
18.3%
jan 1, 1984
0.695
-0.172
-19.8%
jan 1, 1985
0.806
+0.111
15.92%
jan 1, 1986
0.595
-0.211
-26.18%
jan 1, 1987
0.595
+0.0
0.04%
jan 1, 1988
0.404
-0.191
-32.09%
jan 1, 1989
0.356
-0.048
-11.96%
jan 1, 1990
0.338
-0.017
-4.88%
jan 1, 1991
0.227
-0.111
-32.85%
jan 1, 1992
0.537
+0.31
136.61%
jan 1, 1993
0.807
+0.269
50.1%
jan 1, 1994
0.661
-0.146
-18.04%
jan 1, 1995
0.422
-0.239
-36.21%
jan 1, 1996
0.32
-0.101
-24.03%
jan 1, 1997
0.424
+0.103
32.28%
jan 1, 1998
0.57
+0.146
34.5%
jan 1, 1999
0.567
-0.003
-0.46%
jan 1, 2000
0.586
+0.018
3.21%
jan 1, 2001
0.512
-0.074
-12.61%
jan 1, 2002
0.581
+0.069
13.48%
jan 1, 2003
0.459
-0.122
-20.96%
jan 1, 2004
0.422
-0.037
-7.99%
jan 1, 2005
0.735
+0.312
73.91%
jan 1, 2006
0.388
-0.347
-47.24%
jan 1, 2007
0.422
+0.035
8.94%
jan 1, 2008
0.463
+0.04
9.55%
jan 1, 2009
0.606
+0.144
31.04%
jan 1, 2010
0.396
-0.21
-34.72%
jan 1, 2011
0.759
+0.363
91.77%
jan 1, 2012
0.82
+0.061
8.1%
jan 1, 2013
0.895
+0.074
9.07%
jan 1, 2014
0.882
-0.013
-1.45%
jan 1, 2015
1.087
+0.206
23.35%
Ranking of countries by current statistics by years


Comments: