29
/
en
AIzaSyAYiBZKx7MnpbEhh9jyipgxe19OcubqV5w
April 1, 2024
148217
Guyana
GUY
true
2
1
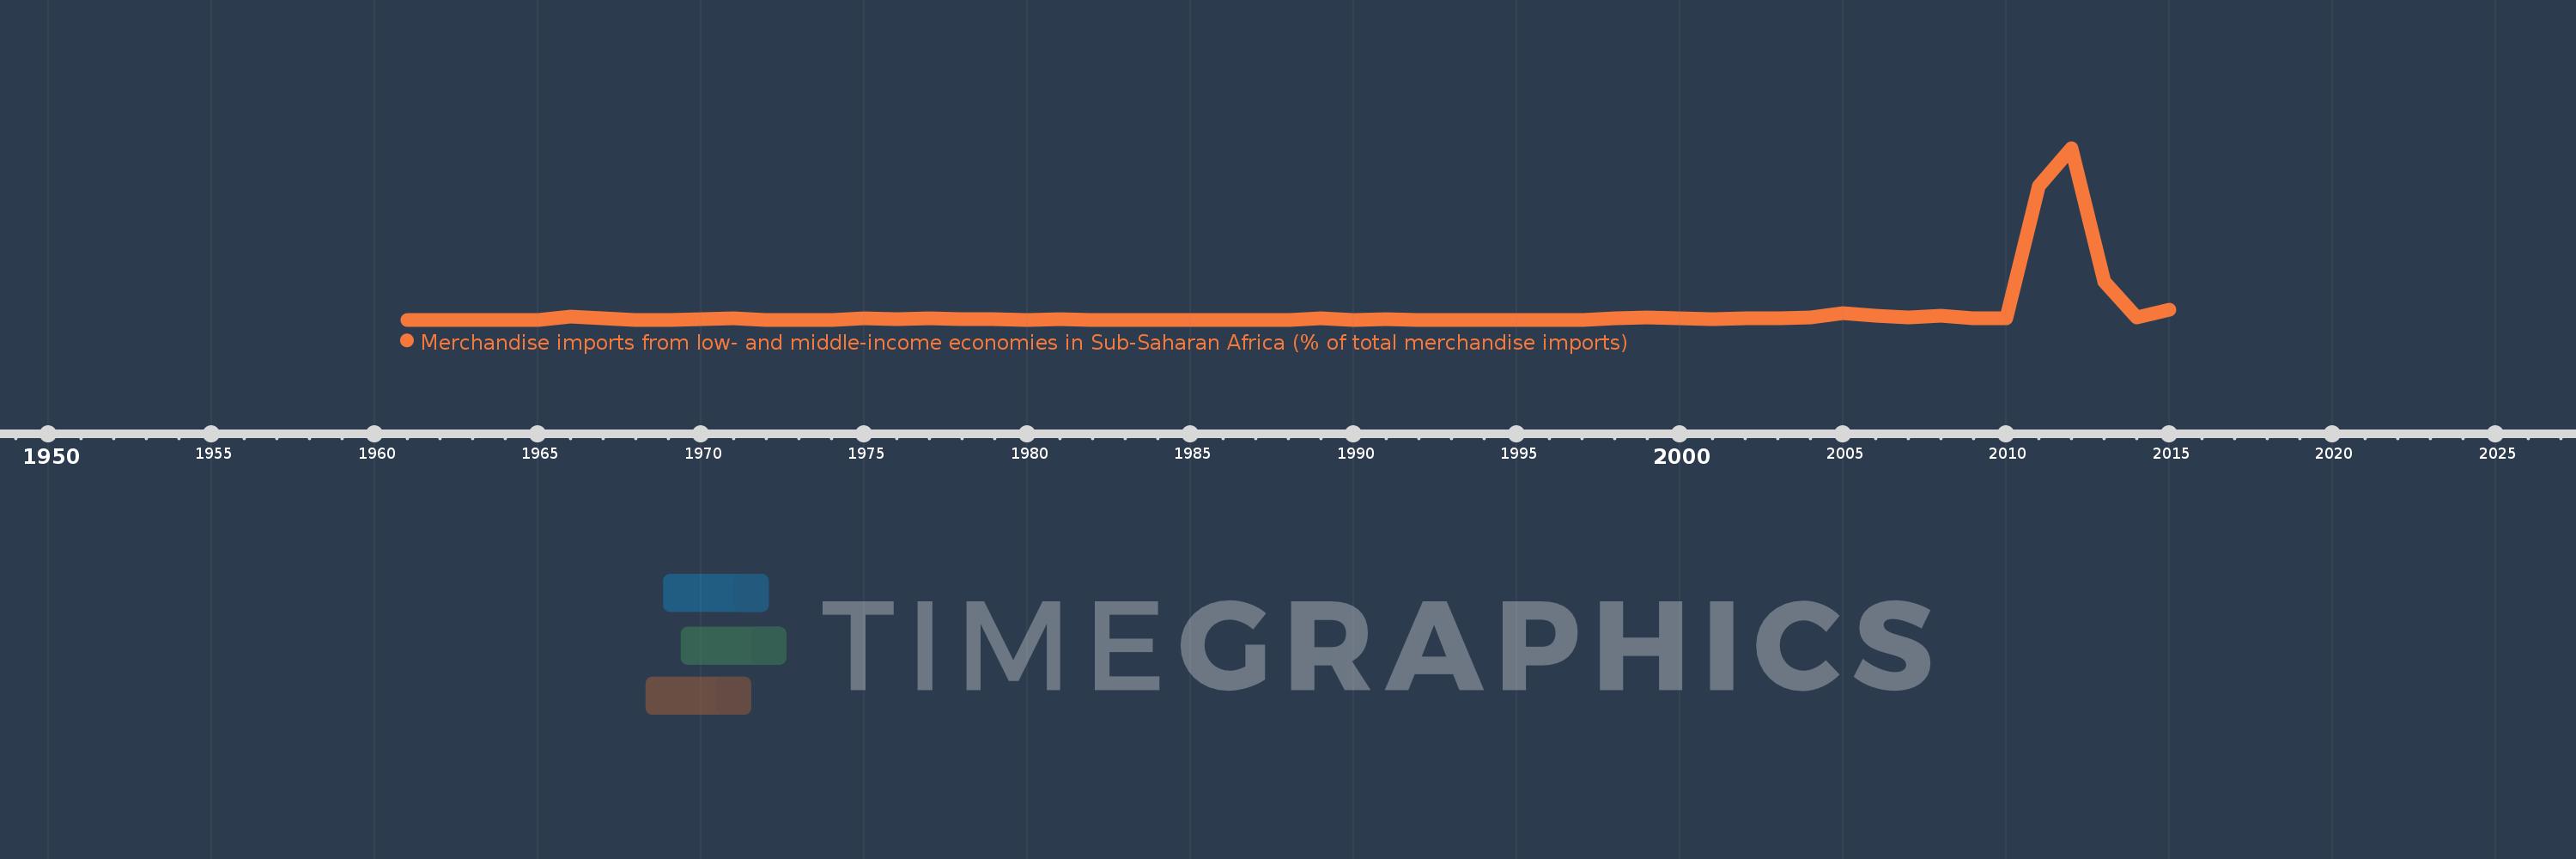
Merchandise imports from low- and middle-income economies in Sub-Saharan Africa (% of total merchandise imports)
2015,2014,2013,2012,2011,2010,2009,2008,2007,2006,2005,2004,2003,2002,2001,2000,1999,1998,1997,1996,1995,1994,1993,1992,1991,1990,1989,1988,1987,1986,1985,1984,1983,1982,1981,1980,1979,1978,1977,1976,1975,1974,1973,1972,1971,1970,1969,1968,1967,1966,1965,1962,1961
This statistics in other country:
AlbaniaAlgeriaAngolaArab WorldArgentinaArmeniaArubaAustraliaAustriaAzerbaijanBahamas, TheBahrainBangladeshBarbadosBelarusBelgiumBelizeBeninBermudaBoliviaBrazilBrunei DarussalamBulgariaBurkina FasoBurundiCabo VerdeCambodiaCameroonCanadaCaribbean small statesCentral African RepublicCentral Europe and the BalticsChadChileChinaColombiaCongo, Dem. Rep.Congo, Rep.Costa RicaCote d'IvoireCroatiaCubaCyprusCzech RepublicDenmarkDjiboutiDominicaDominican RepublicEarly-demographic dividendEast Asia & PacificEast Asia & Pacific (excluding high income)East Asia & Pacific (IDA & IBRD countries)EcuadorEgypt, Arab Rep.El SalvadorEstoniaEthiopiaEuro areaEurope & Central AsiaEurope & Central Asia (excluding high income)Europe & Central Asia (IDA & IBRD countries)European UnionFijiFinlandFragile and conflict affected situationsFranceGabonGambia, TheGeorgiaGermanyGhanaGreeceGreenlandGrenadaGuatemalaGuineaGuinea-BissauGuyanaHaitiHeavily indebted poor countries (HIPC)High incomeHondurasHong Kong SAR, ChinaHungaryIBRD onlyIcelandIDA & IBRD totalIDA blendIDA onlyIDA totalIndiaIndonesiaIran, Islamic Rep.IraqIrelandIsraelItalyJamaicaJapanJordanKazakhstanKenyaKorea, Dem. People’s Rep.Korea, Rep.KuwaitLao PDRLate-demographic dividendLatin America & Caribbean Latin America & Caribbean (excluding high income)Latin America & the Caribbean (IDA & IBRD countries)LatviaLeast developed countries: UN classificationLebanonLiberiaLibyaLithuaniaLow & middle incomeLow incomeLower middle incomeLuxembourgMacao SAR, ChinaMacedonia, FYRMadagascarMalawiMalaysiaMaliMaltaMauritaniaMauritiusMexicoMiddle East & North AfricaMiddle East & North Africa (excluding high income)Middle East & North Africa (IDA & IBRD countries)Middle incomeMoldovaMontenegroMoroccoMozambiqueMyanmarNetherlandsNew CaledoniaNew ZealandNicaraguaNigerNigeriaNorth AmericaNorwayOECD membersOmanOther small statesPacific island small statesPakistanPanamaPapua New GuineaParaguayPeruPhilippinesPolandPortugalPost-demographic dividendPre-demographic dividendQatarRomaniaRussian FederationRwandaSaudi ArabiaSenegalSerbiaSeychellesSierra LeoneSingaporeSlovak RepublicSloveniaSmall statesSomaliaSouth AfricaSouth AsiaSouth Asia (IDA & IBRD)SpainSri LankaSt. LuciaSt. Vincent and the GrenadinesSub-Saharan Africa Sub-Saharan Africa (excluding high income)Sub-Saharan Africa (IDA & IBRD countries)SudanSurinameSwedenSwitzerlandSyrian Arab RepublicTanzaniaThailandTogoTrinidad and TobagoTunisiaTurkeyUgandaUkraineUnited Arab EmiratesUnited KingdomUnited StatesUpper middle incomeUruguayVenezuela, RBVietnamWorldYemen, Rep.ZambiaZimbabwe Timeline:
This timeline shows a graph from 1961 to 2015 of Guyana. No data until 1960. Number of actual observations by date: 53.
Source name:
World Development Indicators
Source organization:
World Bank staff estimates based data from International Monetary Fund's Direction of Trade database.
Categories, topics:
Private Sector, Trade
Last updated:
apr 23, 2017
Indicators value changes by year
At the date of observation
Value
Absolute change
Change from previous value
jan 1, 1966
0.192
+0.192
%
jan 1, 1967
0.085
-0.107
-55.73%
jan 1, 1968
0.0
-0.085
-100.0%
jan 1, 1970
0.054
+0.054
%
jan 1, 1971
0.069
+0.014
26.65%
jan 1, 1972
0.0
-0.069
-100.0%
jan 1, 1975
0.072
+0.072
%
jan 1, 1976
0.03
-0.042
-58.37%
jan 1, 1977
0.07
+0.04
133.98%
jan 1, 1978
0.029
-0.041
-58.38%
jan 1, 1979
0.054
+0.025
83.78%
jan 1, 1980
0.0
-0.054
-100.0%
jan 1, 1981
0.024
+0.024
%
jan 1, 1982
0.002
-0.022
-91.35%
jan 1, 1983
0.009
+0.007
335.92%
jan 1, 1984
0.006
-0.003
-37.68%
jan 1, 1985
0.004
-0.001
-23.66%
jan 1, 1986
0.0
-0.004
-89.55%
jan 1, 1988
0.003
+0.002
471.99%
jan 1, 1989
0.076
+0.073
2.88K%
jan 1, 1990
0.001
-0.074
-98.16%
jan 1, 1991
0.015
+0.013
951.79%
jan 1, 1992
0.0
-0.014
-96.9%
jan 1, 1993
0.002
+0.001
289.53%
jan 1, 1994
0.002
0.0
-5.86%
jan 1, 1995
0.003
+0.001
52.49%
jan 1, 1996
0.004
+0.001
57.68%
jan 1, 1997
0.003
-0.001
-27.07%
jan 1, 1998
0.104
+0.102
3.49K%
jan 1, 1999
0.138
+0.033
31.96%
jan 1, 2000
0.097
-0.041
-29.83%
jan 1, 2001
0.044
-0.053
-54.48%
jan 1, 2002
0.068
+0.023
53.27%
jan 1, 2003
0.058
-0.01
-14.77%
jan 1, 2004
0.15
+0.093
161.23%
jan 1, 2005
0.354
+0.204
135.4%
jan 1, 2006
0.231
-0.123
-34.78%
jan 1, 2007
0.111
-0.12
-51.85%
jan 1, 2008
0.202
+0.091
81.69%
jan 1, 2009
0.093
-0.109
-53.86%
jan 1, 2010
0.064
-0.03
-31.74%
jan 1, 2011
7.428
+7.364
11.58K%
jan 1, 2012
9.531
+2.103
28.32%
jan 1, 2013
2.11
-7.421
-77.86%
jan 1, 2014
0.142
-1.968
-93.28%
jan 1, 2015
0.547
+0.405
285.51%
Ranking of countries by current statistics by years


Comments: