29
/
en
AIzaSyAYiBZKx7MnpbEhh9jyipgxe19OcubqV5w
April 1, 2024
234893
Saudi Arabia
SAU
true
2
1
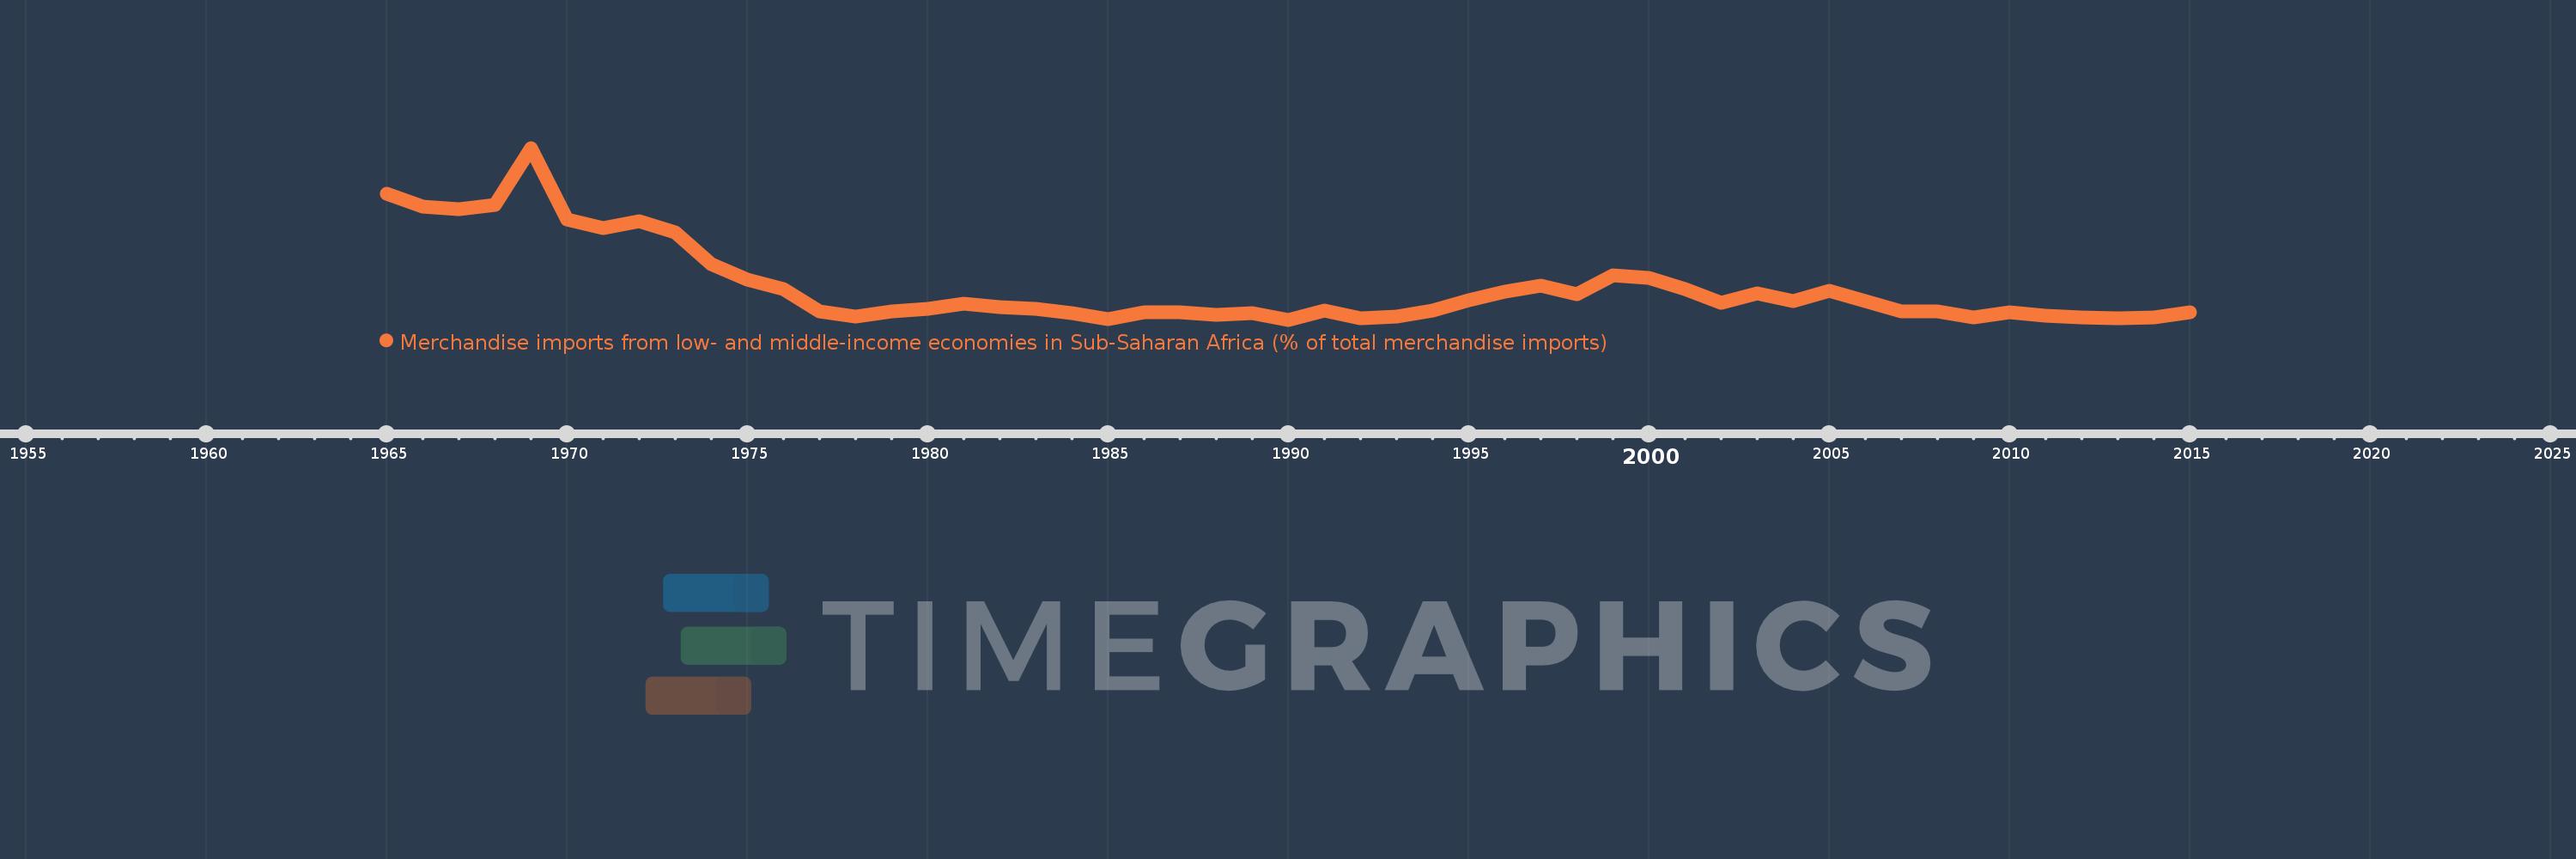
Merchandise imports from low- and middle-income economies in Sub-Saharan Africa (% of total merchandise imports)
2015,2014,2013,2012,2011,2010,2009,2008,2007,2006,2005,2004,2003,2002,2001,2000,1999,1998,1997,1996,1995,1994,1993,1992,1991,1990,1989,1988,1987,1986,1985,1984,1983,1982,1981,1980,1979,1978,1977,1976,1975,1974,1973,1972,1971,1970,1969,1968,1967,1966,1965
This statistics in other country:
AlbaniaAlgeriaAngolaArab WorldArgentinaArmeniaArubaAustraliaAustriaAzerbaijanBahamas, TheBahrainBangladeshBarbadosBelarusBelgiumBelizeBeninBermudaBoliviaBrazilBrunei DarussalamBulgariaBurkina FasoBurundiCabo VerdeCambodiaCameroonCanadaCaribbean small statesCentral African RepublicCentral Europe and the BalticsChadChileChinaColombiaCongo, Dem. Rep.Congo, Rep.Costa RicaCote d'IvoireCroatiaCubaCyprusCzech RepublicDenmarkDjiboutiDominicaDominican RepublicEarly-demographic dividendEast Asia & PacificEast Asia & Pacific (excluding high income)East Asia & Pacific (IDA & IBRD countries)EcuadorEgypt, Arab Rep.El SalvadorEstoniaEthiopiaEuro areaEurope & Central AsiaEurope & Central Asia (excluding high income)Europe & Central Asia (IDA & IBRD countries)European UnionFijiFinlandFragile and conflict affected situationsFranceGabonGambia, TheGeorgiaGermanyGhanaGreeceGreenlandGrenadaGuatemalaGuineaGuinea-BissauGuyanaHaitiHeavily indebted poor countries (HIPC)High incomeHondurasHong Kong SAR, ChinaHungaryIBRD onlyIcelandIDA & IBRD totalIDA blendIDA onlyIDA totalIndiaIndonesiaIran, Islamic Rep.IraqIrelandIsraelItalyJamaicaJapanJordanKazakhstanKenyaKorea, Dem. People’s Rep.Korea, Rep.KuwaitLao PDRLate-demographic dividendLatin America & Caribbean Latin America & Caribbean (excluding high income)Latin America & the Caribbean (IDA & IBRD countries)LatviaLeast developed countries: UN classificationLebanonLiberiaLibyaLithuaniaLow & middle incomeLow incomeLower middle incomeLuxembourgMacao SAR, ChinaMacedonia, FYRMadagascarMalawiMalaysiaMaliMaltaMauritaniaMauritiusMexicoMiddle East & North AfricaMiddle East & North Africa (excluding high income)Middle East & North Africa (IDA & IBRD countries)Middle incomeMoldovaMontenegroMoroccoMozambiqueMyanmarNetherlandsNew CaledoniaNew ZealandNicaraguaNigerNigeriaNorth AmericaNorwayOECD membersOmanOther small statesPacific island small statesPakistanPanamaPapua New GuineaParaguayPeruPhilippinesPolandPortugalPost-demographic dividendPre-demographic dividendQatarRomaniaRussian FederationRwandaSaudi ArabiaSenegalSerbiaSeychellesSierra LeoneSingaporeSlovak RepublicSloveniaSmall statesSomaliaSouth AfricaSouth AsiaSouth Asia (IDA & IBRD)SpainSri LankaSt. LuciaSt. Vincent and the GrenadinesSub-Saharan Africa Sub-Saharan Africa (excluding high income)Sub-Saharan Africa (IDA & IBRD countries)SudanSurinameSwedenSwitzerlandSyrian Arab RepublicTanzaniaThailandTogoTrinidad and TobagoTunisiaTurkeyUgandaUkraineUnited Arab EmiratesUnited KingdomUnited StatesUpper middle incomeUruguayVenezuela, RBVietnamWorldYemen, Rep.ZambiaZimbabwe Timeline:
This timeline shows a graph from 1965 to 2015 of Saudi Arabia. No data until 1964. Number of actual observations by date: 51.
Source name:
World Development Indicators
Source organization:
World Bank staff estimates based data from International Monetary Fund's Direction of Trade database.
Categories, topics:
Private Sector, Trade
Last updated:
apr 23, 2017
Indicators value changes by year
At the date of observation
Value
Absolute change
Change from previous value
jan 1, 1965
6.135
+6.135
0.0%
jan 1, 1966
5.581
-0.555
-9.04%
jan 1, 1967
5.45
-0.131
-2.35%
jan 1, 1968
5.644
+0.194
3.57%
jan 1, 1969
8.137
+2.493
44.16%
jan 1, 1970
5.003
-3.134
-38.51%
jan 1, 1971
4.634
-0.369
-7.37%
jan 1, 1972
4.944
+0.31
6.69%
jan 1, 1973
4.43
-0.515
-10.41%
jan 1, 1974
3.041
-1.389
-31.35%
jan 1, 1975
2.366
-0.675
-22.21%
jan 1, 1976
1.975
-0.391
-16.53%
jan 1, 1977
0.986
-0.989
-50.08%
jan 1, 1978
0.742
-0.244
-24.75%
jan 1, 1979
0.971
+0.229
30.84%
jan 1, 1980
1.102
+0.131
13.49%
jan 1, 1981
1.315
+0.213
19.35%
jan 1, 1982
1.165
-0.15
-11.41%
jan 1, 1983
1.09
-0.075
-6.42%
jan 1, 1984
0.917
-0.173
-15.86%
jan 1, 1985
0.657
-0.26
-28.32%
jan 1, 1986
0.938
+0.281
42.71%
jan 1, 1987
0.927
-0.011
-1.22%
jan 1, 1988
0.846
-0.081
-8.69%
jan 1, 1989
0.897
+0.051
6.06%
jan 1, 1990
0.616
-0.281
-31.35%
jan 1, 1991
1.025
+0.409
66.43%
jan 1, 1992
0.682
-0.343
-33.45%
jan 1, 1993
0.767
+0.085
12.48%
jan 1, 1994
1.029
+0.262
34.14%
jan 1, 1995
1.456
+0.426
41.39%
jan 1, 1996
1.847
+0.391
26.86%
jan 1, 1997
2.095
+0.249
13.47%
jan 1, 1998
1.719
-0.376
-17.94%
jan 1, 1999
2.566
+0.846
49.22%
jan 1, 2000
2.431
-0.134
-5.24%
jan 1, 2001
1.96
-0.471
-19.39%
jan 1, 2002
1.342
-0.618
-31.53%
jan 1, 2003
1.761
+0.419
31.26%
jan 1, 2004
1.42
-0.341
-19.38%
jan 1, 2005
1.882
+0.462
32.55%
jan 1, 2006
1.417
-0.465
-24.7%
jan 1, 2007
0.975
-0.442
-31.19%
jan 1, 2008
0.965
-0.01
-1.07%
jan 1, 2009
0.702
-0.263
-27.23%
jan 1, 2010
0.948
+0.246
35.07%
jan 1, 2011
0.797
-0.151
-15.95%
jan 1, 2012
0.734
-0.063
-7.93%
jan 1, 2013
0.696
-0.038
-5.16%
jan 1, 2014
0.712
+0.016
2.3%
jan 1, 2015
0.925
+0.213
29.91%
Ranking of countries by current statistics by years


Comments: