29
/
en
AIzaSyAYiBZKx7MnpbEhh9jyipgxe19OcubqV5w
April 1, 2024
112553
Costa Rica
CRI
true
2
1
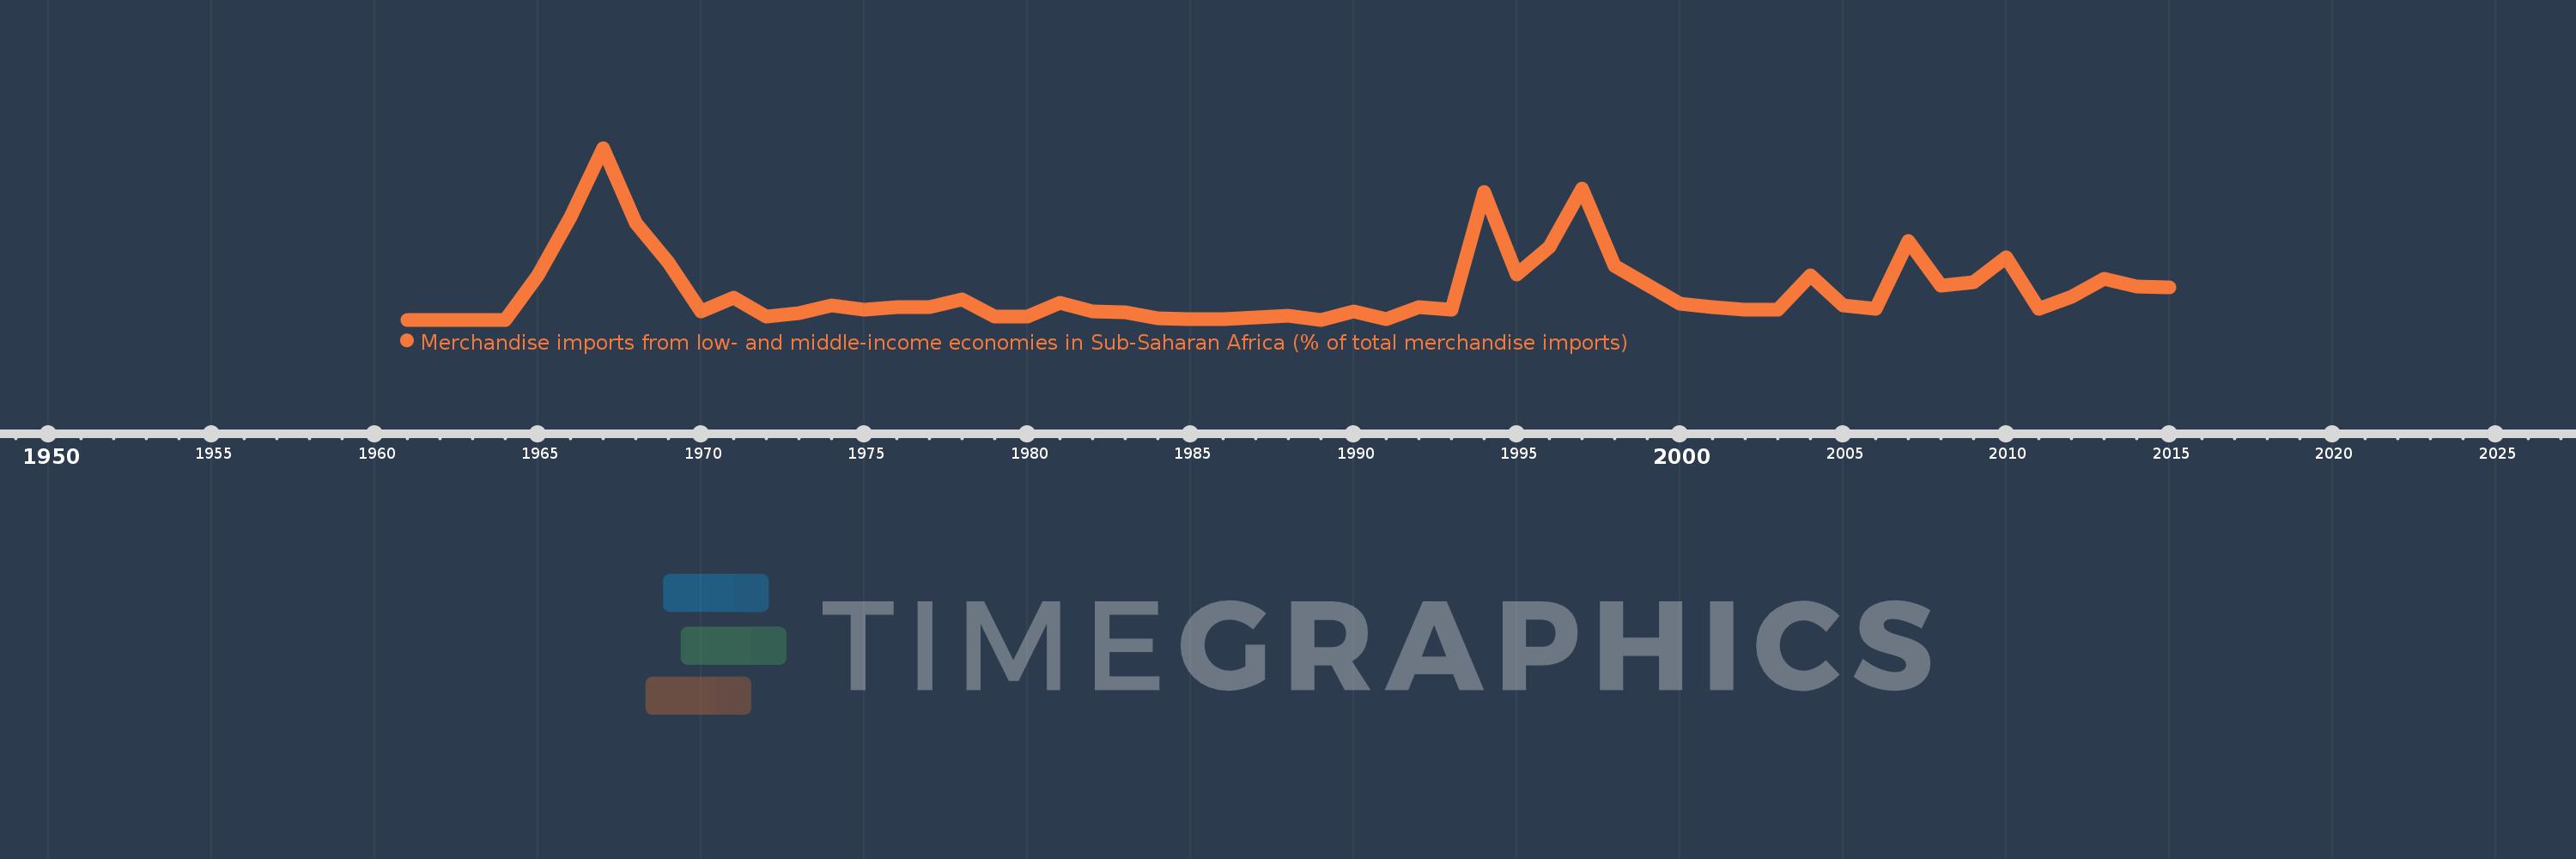
Merchandise imports from low- and middle-income economies in Sub-Saharan Africa (% of total merchandise imports)
2015,2014,2013,2012,2011,2010,2009,2008,2007,2006,2005,2004,2003,2002,2001,2000,1999,1998,1997,1996,1995,1994,1993,1992,1991,1990,1989,1988,1987,1986,1985,1984,1983,1982,1981,1980,1979,1978,1977,1976,1975,1974,1973,1972,1971,1970,1969,1968,1967,1966,1965,1964,1963,1962,1961
This statistics in other country:
AlbaniaAlgeriaAngolaArab WorldArgentinaArmeniaArubaAustraliaAustriaAzerbaijanBahamas, TheBahrainBangladeshBarbadosBelarusBelgiumBelizeBeninBermudaBoliviaBrazilBrunei DarussalamBulgariaBurkina FasoBurundiCabo VerdeCambodiaCameroonCanadaCaribbean small statesCentral African RepublicCentral Europe and the BalticsChadChileChinaColombiaCongo, Dem. Rep.Congo, Rep.Costa RicaCote d'IvoireCroatiaCubaCyprusCzech RepublicDenmarkDjiboutiDominicaDominican RepublicEarly-demographic dividendEast Asia & PacificEast Asia & Pacific (excluding high income)East Asia & Pacific (IDA & IBRD countries)EcuadorEgypt, Arab Rep.El SalvadorEstoniaEthiopiaEuro areaEurope & Central AsiaEurope & Central Asia (excluding high income)Europe & Central Asia (IDA & IBRD countries)European UnionFijiFinlandFragile and conflict affected situationsFranceGabonGambia, TheGeorgiaGermanyGhanaGreeceGreenlandGrenadaGuatemalaGuineaGuinea-BissauGuyanaHaitiHeavily indebted poor countries (HIPC)High incomeHondurasHong Kong SAR, ChinaHungaryIBRD onlyIcelandIDA & IBRD totalIDA blendIDA onlyIDA totalIndiaIndonesiaIran, Islamic Rep.IraqIrelandIsraelItalyJamaicaJapanJordanKazakhstanKenyaKorea, Dem. People’s Rep.Korea, Rep.KuwaitLao PDRLate-demographic dividendLatin America & Caribbean Latin America & Caribbean (excluding high income)Latin America & the Caribbean (IDA & IBRD countries)LatviaLeast developed countries: UN classificationLebanonLiberiaLibyaLithuaniaLow & middle incomeLow incomeLower middle incomeLuxembourgMacao SAR, ChinaMacedonia, FYRMadagascarMalawiMalaysiaMaliMaltaMauritaniaMauritiusMexicoMiddle East & North AfricaMiddle East & North Africa (excluding high income)Middle East & North Africa (IDA & IBRD countries)Middle incomeMoldovaMontenegroMoroccoMozambiqueMyanmarNetherlandsNew CaledoniaNew ZealandNicaraguaNigerNigeriaNorth AmericaNorwayOECD membersOmanOther small statesPacific island small statesPakistanPanamaPapua New GuineaParaguayPeruPhilippinesPolandPortugalPost-demographic dividendPre-demographic dividendQatarRomaniaRussian FederationRwandaSaudi ArabiaSenegalSerbiaSeychellesSierra LeoneSingaporeSlovak RepublicSloveniaSmall statesSomaliaSouth AfricaSouth AsiaSouth Asia (IDA & IBRD)SpainSri LankaSt. LuciaSt. Vincent and the GrenadinesSub-Saharan Africa Sub-Saharan Africa (excluding high income)Sub-Saharan Africa (IDA & IBRD countries)SudanSurinameSwedenSwitzerlandSyrian Arab RepublicTanzaniaThailandTogoTrinidad and TobagoTunisiaTurkeyUgandaUkraineUnited Arab EmiratesUnited KingdomUnited StatesUpper middle incomeUruguayVenezuela, RBVietnamWorldYemen, Rep.ZambiaZimbabwe Timeline:
This timeline shows a graph from 1961 to 2015 of Costa Rica. No data until 1960. Number of actual observations by date: 55.
Source name:
World Development Indicators
Source organization:
World Bank staff estimates based data from International Monetary Fund's Direction of Trade database.
Categories, topics:
Private Sector, Trade
Last updated:
apr 23, 2017
Indicators value changes by year
At the date of observation
Value
Absolute change
Change from previous value
jan 1, 1965
0.073
+0.073
%
jan 1, 1966
0.168
+0.096
131.78%
jan 1, 1967
0.281
+0.112
66.67%
jan 1, 1968
0.158
-0.122
-43.55%
jan 1, 1969
0.094
-0.064
-40.42%
jan 1, 1970
0.014
-0.081
-85.26%
jan 1, 1971
0.036
+0.022
158.71%
jan 1, 1972
0.005
-0.031
-84.91%
jan 1, 1973
0.011
+0.006
107.05%
jan 1, 1974
0.023
+0.012
105.13%
jan 1, 1975
0.016
-0.007
-30.72%
jan 1, 1976
0.02
+0.004
22.76%
jan 1, 1977
0.021
+0.001
5.34%
jan 1, 1978
0.033
+0.012
58.7%
jan 1, 1979
0.005
-0.028
-84.08%
jan 1, 1980
0.005
+0.0
1.39%
jan 1, 1981
0.027
+0.022
411.16%
jan 1, 1982
0.014
-0.013
-48.34%
jan 1, 1983
0.012
-0.002
-15.12%
jan 1, 1984
0.002
-0.01
-86.38%
jan 1, 1985
0.001
-0.001
-43.31%
jan 1, 1986
0.001
+0.0
29.35%
jan 1, 1987
0.004
+0.003
231.65%
jan 1, 1988
0.007
+0.003
74.54%
jan 1, 1989
0.0
-0.006
-94.7%
jan 1, 1990
0.014
+0.014
3.72K%
jan 1, 1991
0.001
-0.013
-92.58%
jan 1, 1992
0.021
+0.02
1.95K%
jan 1, 1993
0.016
-0.005
-23.51%
jan 1, 1994
0.209
+0.193
1.2K%
jan 1, 1995
0.074
-0.135
-64.53%
jan 1, 1996
0.119
+0.045
60.1%
jan 1, 1997
0.214
+0.095
79.75%
jan 1, 1998
0.088
-0.125
-58.6%
jan 1, 1999
0.057
-0.032
-35.64%
jan 1, 2000
0.026
-0.031
-54.25%
jan 1, 2001
0.02
-0.006
-23.8%
jan 1, 2002
0.017
-0.003
-15.25%
jan 1, 2003
0.017
+0.0
0.35%
jan 1, 2004
0.073
+0.056
331.24%
jan 1, 2005
0.024
-0.049
-66.98%
jan 1, 2006
0.018
-0.006
-24.49%
jan 1, 2007
0.129
+0.111
612.2%
jan 1, 2008
0.056
-0.074
-56.95%
jan 1, 2009
0.062
+0.006
11.55%
jan 1, 2010
0.102
+0.04
63.9%
jan 1, 2011
0.018
-0.083
-81.92%
jan 1, 2012
0.037
+0.019
102.0%
jan 1, 2013
0.067
+0.03
81.33%
jan 1, 2014
0.054
-0.013
-19.17%
jan 1, 2015
0.053
-0.002
-2.89%
Ranking of countries by current statistics by years


Comments: