29
/
en
AIzaSyAYiBZKx7MnpbEhh9jyipgxe19OcubqV5w
April 1, 2024
167787
Kenya
KEN
true
2
1
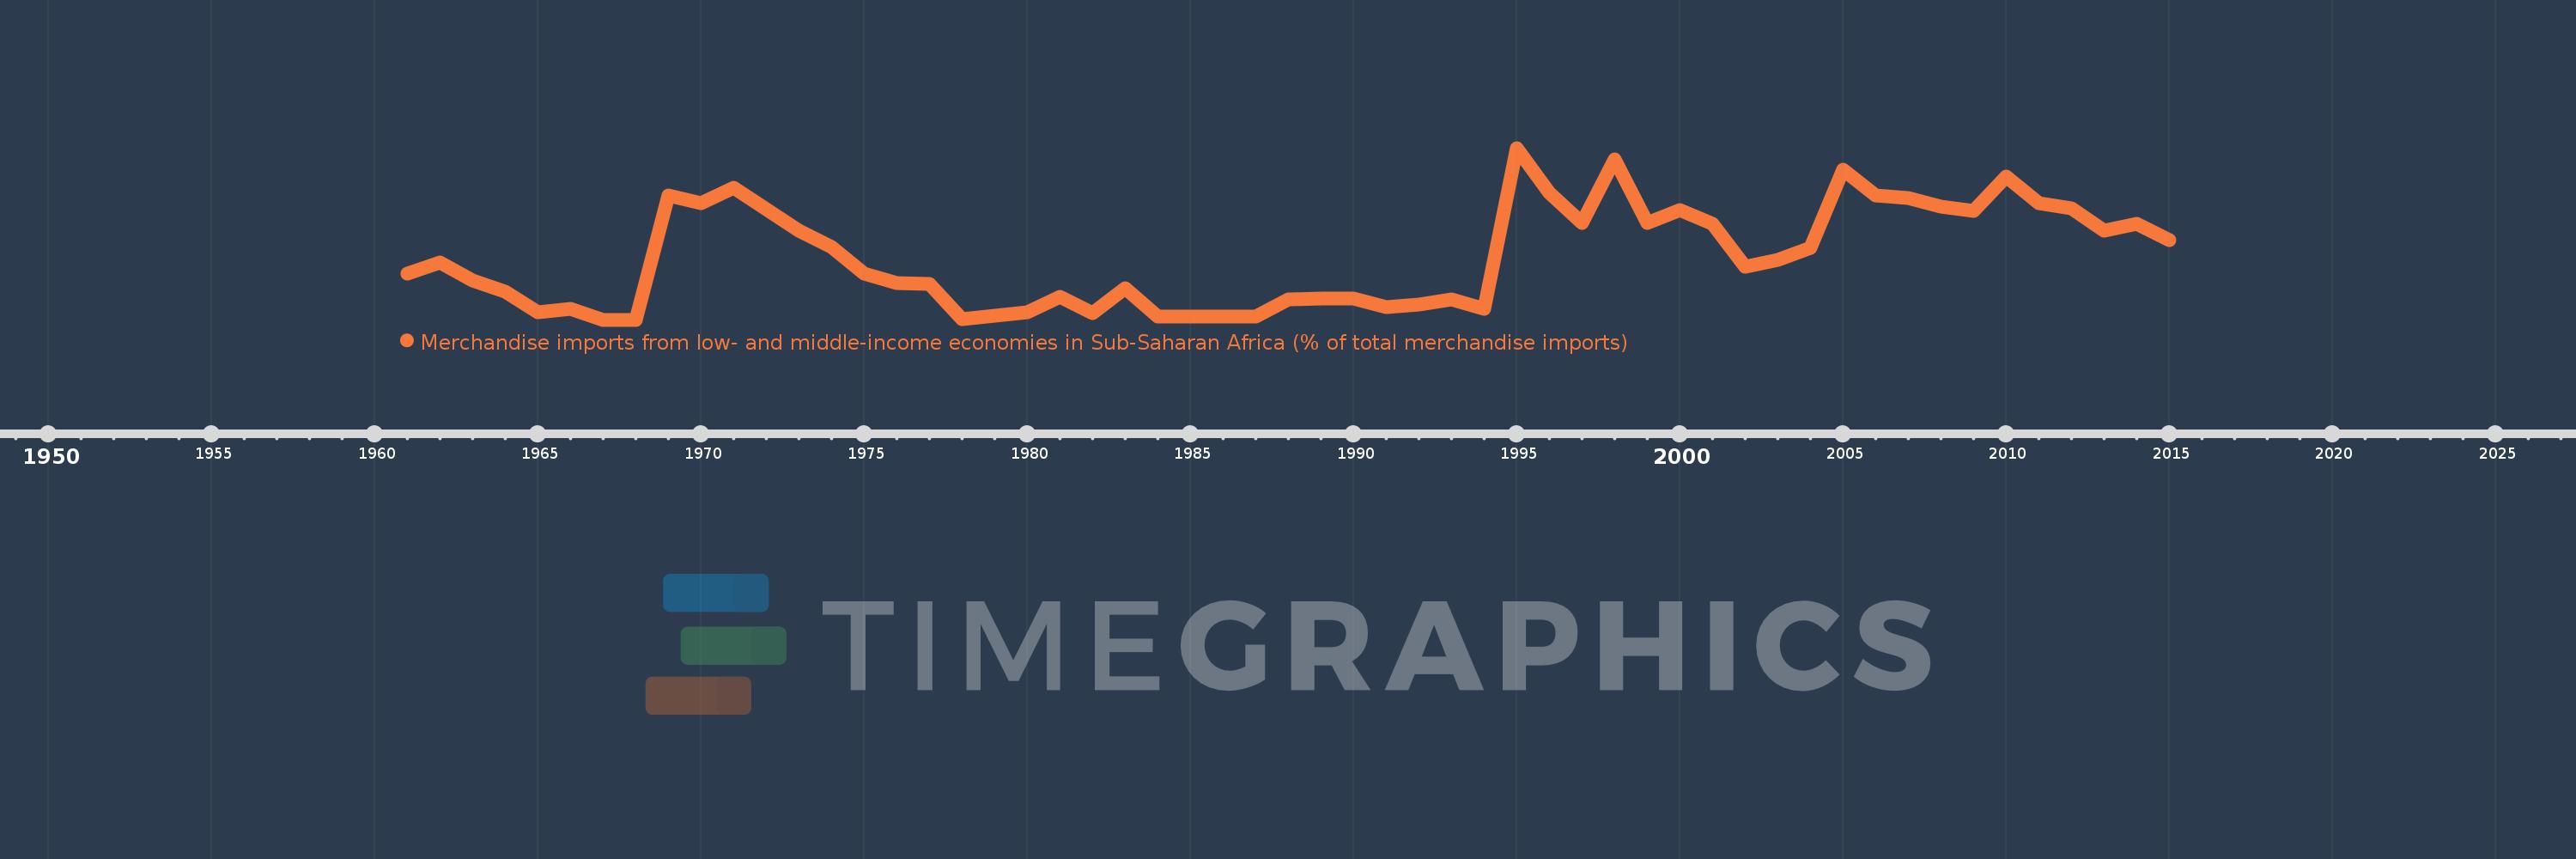
Merchandise imports from low- and middle-income economies in Sub-Saharan Africa (% of total merchandise imports)
2015,2014,2013,2012,2011,2010,2009,2008,2007,2006,2005,2004,2003,2002,2001,2000,1999,1998,1997,1996,1995,1994,1993,1992,1991,1990,1989,1988,1987,1986,1985,1984,1983,1982,1981,1980,1979,1978,1977,1976,1975,1974,1973,1972,1971,1970,1969,1968,1967,1966,1965,1964,1963,1962,1961
This statistics in other country:
AlbaniaAlgeriaAngolaArab WorldArgentinaArmeniaArubaAustraliaAustriaAzerbaijanBahamas, TheBahrainBangladeshBarbadosBelarusBelgiumBelizeBeninBermudaBoliviaBrazilBrunei DarussalamBulgariaBurkina FasoBurundiCabo VerdeCambodiaCameroonCanadaCaribbean small statesCentral African RepublicCentral Europe and the BalticsChadChileChinaColombiaCongo, Dem. Rep.Congo, Rep.Costa RicaCote d'IvoireCroatiaCubaCyprusCzech RepublicDenmarkDjiboutiDominicaDominican RepublicEarly-demographic dividendEast Asia & PacificEast Asia & Pacific (excluding high income)East Asia & Pacific (IDA & IBRD countries)EcuadorEgypt, Arab Rep.El SalvadorEstoniaEthiopiaEuro areaEurope & Central AsiaEurope & Central Asia (excluding high income)Europe & Central Asia (IDA & IBRD countries)European UnionFijiFinlandFragile and conflict affected situationsFranceGabonGambia, TheGeorgiaGermanyGhanaGreeceGreenlandGrenadaGuatemalaGuineaGuinea-BissauGuyanaHaitiHeavily indebted poor countries (HIPC)High incomeHondurasHong Kong SAR, ChinaHungaryIBRD onlyIcelandIDA & IBRD totalIDA blendIDA onlyIDA totalIndiaIndonesiaIran, Islamic Rep.IraqIrelandIsraelItalyJamaicaJapanJordanKazakhstanKenyaKorea, Dem. People’s Rep.Korea, Rep.KuwaitLao PDRLate-demographic dividendLatin America & Caribbean Latin America & Caribbean (excluding high income)Latin America & the Caribbean (IDA & IBRD countries)LatviaLeast developed countries: UN classificationLebanonLiberiaLibyaLithuaniaLow & middle incomeLow incomeLower middle incomeLuxembourgMacao SAR, ChinaMacedonia, FYRMadagascarMalawiMalaysiaMaliMaltaMauritaniaMauritiusMexicoMiddle East & North AfricaMiddle East & North Africa (excluding high income)Middle East & North Africa (IDA & IBRD countries)Middle incomeMoldovaMontenegroMoroccoMozambiqueMyanmarNetherlandsNew CaledoniaNew ZealandNicaraguaNigerNigeriaNorth AmericaNorwayOECD membersOmanOther small statesPacific island small statesPakistanPanamaPapua New GuineaParaguayPeruPhilippinesPolandPortugalPost-demographic dividendPre-demographic dividendQatarRomaniaRussian FederationRwandaSaudi ArabiaSenegalSerbiaSeychellesSierra LeoneSingaporeSlovak RepublicSloveniaSmall statesSomaliaSouth AfricaSouth AsiaSouth Asia (IDA & IBRD)SpainSri LankaSt. LuciaSt. Vincent and the GrenadinesSub-Saharan Africa Sub-Saharan Africa (excluding high income)Sub-Saharan Africa (IDA & IBRD countries)SudanSurinameSwedenSwitzerlandSyrian Arab RepublicTanzaniaThailandTogoTrinidad and TobagoTunisiaTurkeyUgandaUkraineUnited Arab EmiratesUnited KingdomUnited StatesUpper middle incomeUruguayVenezuela, RBVietnamWorldYemen, Rep.ZambiaZimbabwe Timeline:
This timeline shows a graph from 1961 to 2015 of Kenya. No data until 1960. Number of actual observations by date: 55.
Source name:
World Development Indicators
Source organization:
World Bank staff estimates based data from International Monetary Fund's Direction of Trade database.
Categories, topics:
Private Sector, Trade
Last updated:
apr 23, 2017
Indicators value changes by year
Maximum:
14.069
jan 1, 1995
At the date of observation
Value
Absolute change
Change from previous value
jan 1, 1961
4.768
+4.768
0.0%
jan 1, 1962
5.631
+0.863
18.11%
jan 1, 1963
4.274
-1.357
-24.1%
jan 1, 1964
3.429
-0.845
-19.77%
jan 1, 1965
1.929
-1.5
-43.73%
jan 1, 1966
2.189
+0.259
13.45%
jan 1, 1967
1.366
-0.823
-37.6%
jan 1, 1968
1.372
+0.006
0.42%
jan 1, 1969
10.532
+9.16
667.81%
jan 1, 1970
10.009
-0.523
-4.96%
jan 1, 1971
11.119
+1.11
11.09%
jan 1, 1972
9.522
-1.598
-14.37%
jan 1, 1973
7.966
-1.555
-16.34%
jan 1, 1974
6.743
-1.223
-15.35%
jan 1, 1975
4.795
-1.948
-28.89%
jan 1, 1976
4.077
-0.718
-14.98%
jan 1, 1977
4.025
-0.052
-1.27%
jan 1, 1978
1.405
-2.621
-65.11%
jan 1, 1979
1.669
+0.264
18.82%
jan 1, 1980
1.945
+0.276
16.56%
jan 1, 1981
3.049
+1.104
56.75%
jan 1, 1982
1.851
-1.199
-39.32%
jan 1, 1983
3.688
+1.838
99.3%
jan 1, 1984
1.606
-2.082
-56.45%
jan 1, 1985
1.585
-0.021
-1.3%
jan 1, 1986
1.585
+0.0
0.0%
jan 1, 1987
1.585
+0.0
0.0%
jan 1, 1988
2.88
+1.294
81.63%
jan 1, 1989
2.918
+0.038
1.32%
jan 1, 1990
2.918
+0.0
0.0%
jan 1, 1991
2.277
-0.64
-21.95%
jan 1, 1992
2.48
+0.203
8.9%
jan 1, 1993
2.866
+0.386
15.56%
jan 1, 1994
2.201
-0.665
-23.21%
jan 1, 1995
14.069
+11.869
539.31%
jan 1, 1996
10.773
-3.296
-23.43%
jan 1, 1997
8.524
-2.249
-20.88%
jan 1, 1998
13.198
+4.674
54.83%
jan 1, 1999
8.507
-4.691
-35.54%
jan 1, 2000
9.487
+0.98
11.52%
jan 1, 2001
8.434
-1.053
-11.09%
jan 1, 2002
5.257
-3.178
-37.68%
jan 1, 2003
5.796
+0.54
10.27%
jan 1, 2004
6.71
+0.913
15.76%
jan 1, 2005
12.481
+5.771
86.01%
jan 1, 2006
10.529
-1.952
-15.64%
jan 1, 2007
10.38
-0.15
-1.42%
jan 1, 2008
9.734
-0.646
-6.22%
jan 1, 2009
9.445
-0.289
-2.96%
jan 1, 2010
11.955
+2.51
26.58%
jan 1, 2011
10.0
-1.956
-16.36%
jan 1, 2012
9.581
-0.419
-4.19%
jan 1, 2013
7.974
-1.606
-16.77%
jan 1, 2014
8.459
+0.485
6.08%
jan 1, 2015
7.271
-1.189
-14.05%
Ranking of countries by current statistics by years


Comments: