29
/
en
AIzaSyAYiBZKx7MnpbEhh9jyipgxe19OcubqV5w
April 1, 2024
262552
Thailand
THA
true
2
1
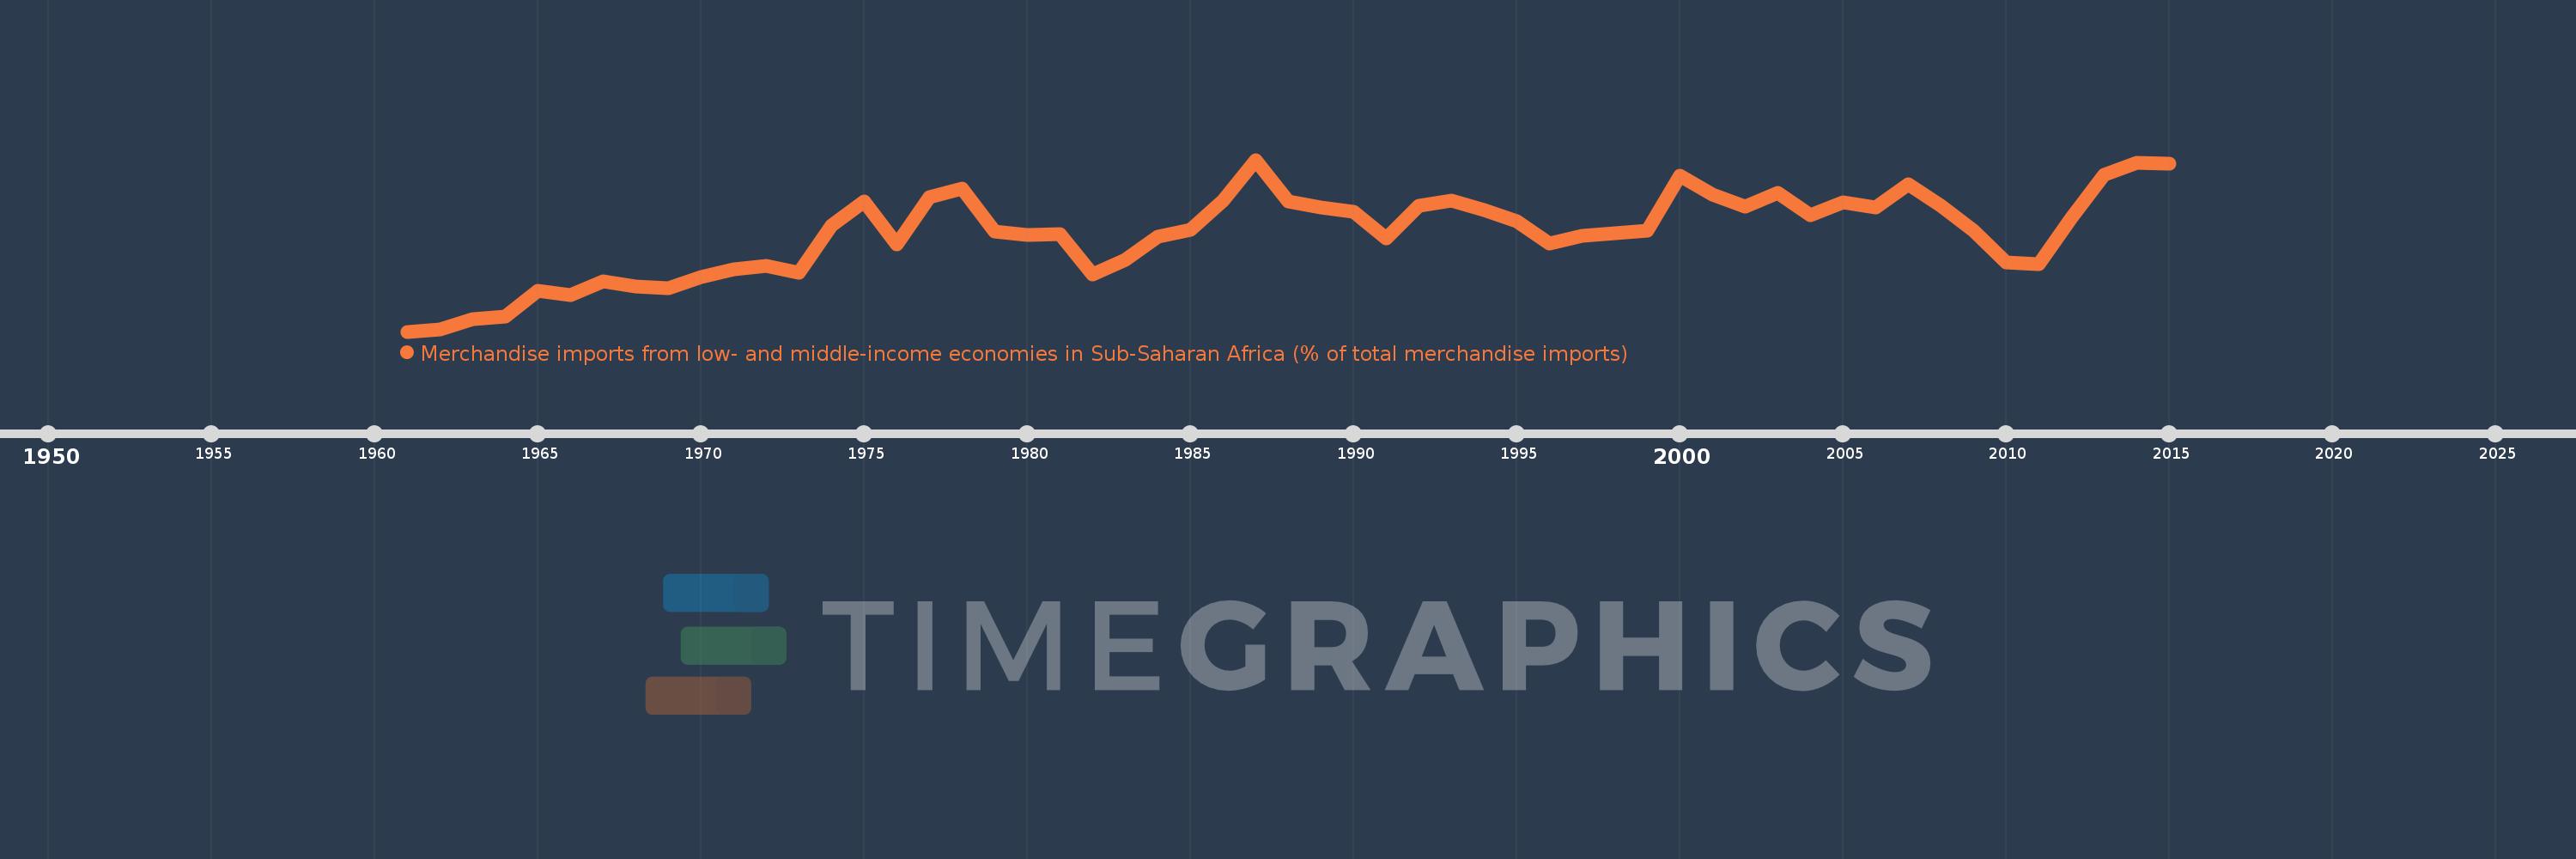
Merchandise imports from low- and middle-income economies in Sub-Saharan Africa (% of total merchandise imports)
2015,2014,2013,2012,2011,2010,2009,2008,2007,2006,2005,2004,2003,2002,2001,2000,1999,1998,1997,1996,1995,1994,1993,1992,1991,1990,1989,1988,1987,1986,1985,1984,1983,1982,1981,1980,1979,1978,1977,1976,1975,1974,1973,1972,1971,1970,1969,1968,1967,1966,1965,1964,1963,1962,1961
This statistics in other country:
AlbaniaAlgeriaAngolaArab WorldArgentinaArmeniaArubaAustraliaAustriaAzerbaijanBahamas, TheBahrainBangladeshBarbadosBelarusBelgiumBelizeBeninBermudaBoliviaBrazilBrunei DarussalamBulgariaBurkina FasoBurundiCabo VerdeCambodiaCameroonCanadaCaribbean small statesCentral African RepublicCentral Europe and the BalticsChadChileChinaColombiaCongo, Dem. Rep.Congo, Rep.Costa RicaCote d'IvoireCroatiaCubaCyprusCzech RepublicDenmarkDjiboutiDominicaDominican RepublicEarly-demographic dividendEast Asia & PacificEast Asia & Pacific (excluding high income)East Asia & Pacific (IDA & IBRD countries)EcuadorEgypt, Arab Rep.El SalvadorEstoniaEthiopiaEuro areaEurope & Central AsiaEurope & Central Asia (excluding high income)Europe & Central Asia (IDA & IBRD countries)European UnionFijiFinlandFragile and conflict affected situationsFranceGabonGambia, TheGeorgiaGermanyGhanaGreeceGreenlandGrenadaGuatemalaGuineaGuinea-BissauGuyanaHaitiHeavily indebted poor countries (HIPC)High incomeHondurasHong Kong SAR, ChinaHungaryIBRD onlyIcelandIDA & IBRD totalIDA blendIDA onlyIDA totalIndiaIndonesiaIran, Islamic Rep.IraqIrelandIsraelItalyJamaicaJapanJordanKazakhstanKenyaKorea, Dem. People’s Rep.Korea, Rep.KuwaitLao PDRLate-demographic dividendLatin America & Caribbean Latin America & Caribbean (excluding high income)Latin America & the Caribbean (IDA & IBRD countries)LatviaLeast developed countries: UN classificationLebanonLiberiaLibyaLithuaniaLow & middle incomeLow incomeLower middle incomeLuxembourgMacao SAR, ChinaMacedonia, FYRMadagascarMalawiMalaysiaMaliMaltaMauritaniaMauritiusMexicoMiddle East & North AfricaMiddle East & North Africa (excluding high income)Middle East & North Africa (IDA & IBRD countries)Middle incomeMoldovaMontenegroMoroccoMozambiqueMyanmarNetherlandsNew CaledoniaNew ZealandNicaraguaNigerNigeriaNorth AmericaNorwayOECD membersOmanOther small statesPacific island small statesPakistanPanamaPapua New GuineaParaguayPeruPhilippinesPolandPortugalPost-demographic dividendPre-demographic dividendQatarRomaniaRussian FederationRwandaSaudi ArabiaSenegalSerbiaSeychellesSierra LeoneSingaporeSlovak RepublicSloveniaSmall statesSomaliaSouth AfricaSouth AsiaSouth Asia (IDA & IBRD)SpainSri LankaSt. LuciaSt. Vincent and the GrenadinesSub-Saharan Africa Sub-Saharan Africa (excluding high income)Sub-Saharan Africa (IDA & IBRD countries)SudanSurinameSwedenSwitzerlandSyrian Arab RepublicTanzaniaThailandTogoTrinidad and TobagoTunisiaTurkeyUgandaUkraineUnited Arab EmiratesUnited KingdomUnited StatesUpper middle incomeUruguayVenezuela, RBVietnamWorldYemen, Rep.ZambiaZimbabwe Timeline:
This timeline shows a graph from 1961 to 2015 of Thailand. No data until 1960. Number of actual observations by date: 55.
Source name:
World Development Indicators
Source organization:
World Bank staff estimates based data from International Monetary Fund's Direction of Trade database.
Categories, topics:
Private Sector, Trade
Last updated:
apr 23, 2017
Indicators value changes by year
At the date of observation
Value
Absolute change
Change from previous value
jan 1, 1961
0.046
+0.046
0.0%
jan 1, 1962
0.064
+0.018
38.98%
jan 1, 1963
0.148
+0.084
131.27%
jan 1, 1964
0.169
+0.021
14.16%
jan 1, 1965
0.381
+0.212
125.55%
jan 1, 1966
0.348
-0.033
-8.69%
jan 1, 1967
0.458
+0.11
31.45%
jan 1, 1968
0.415
-0.042
-9.23%
jan 1, 1969
0.403
-0.013
-3.09%
jan 1, 1970
0.493
+0.091
22.55%
jan 1, 1971
0.558
+0.065
13.14%
jan 1, 1972
0.586
+0.027
4.88%
jan 1, 1973
0.531
-0.055
-9.33%
jan 1, 1974
0.915
+0.384
72.4%
jan 1, 1975
1.116
+0.201
21.98%
jan 1, 1976
0.761
-0.356
-31.85%
jan 1, 1977
1.15
+0.389
51.07%
jan 1, 1978
1.222
+0.072
6.31%
jan 1, 1979
0.866
-0.356
-29.13%
jan 1, 1980
0.837
-0.029
-3.3%
jan 1, 1981
0.846
+0.009
1.06%
jan 1, 1982
0.515
-0.331
-39.1%
jan 1, 1983
0.639
+0.123
23.9%
jan 1, 1984
0.829
+0.191
29.83%
jan 1, 1985
0.883
+0.054
6.52%
jan 1, 1986
1.123
+0.24
27.15%
jan 1, 1987
1.458
+0.335
29.85%
jan 1, 1988
1.117
-0.342
-23.43%
jan 1, 1989
1.066
-0.051
-4.53%
jan 1, 1990
1.034
-0.032
-3.01%
jan 1, 1991
0.812
-0.222
-21.44%
jan 1, 1992
1.083
+0.271
33.31%
jan 1, 1993
1.121
+0.039
3.56%
jan 1, 1994
1.047
-0.074
-6.64%
jan 1, 1995
0.956
-0.091
-8.64%
jan 1, 1996
0.77
-0.187
-19.51%
jan 1, 1997
0.831
+0.061
7.88%
jan 1, 1998
0.856
+0.026
3.07%
jan 1, 1999
0.874
+0.018
2.14%
jan 1, 2000
1.33
+0.456
52.16%
jan 1, 2001
1.17
-0.16
-12.02%
jan 1, 2002
1.076
-0.094
-8.07%
jan 1, 2003
1.187
+0.111
10.3%
jan 1, 2004
1.001
-0.186
-15.68%
jan 1, 2005
1.111
+0.11
10.97%
jan 1, 2006
1.066
-0.045
-4.03%
jan 1, 2007
1.26
+0.194
18.19%
jan 1, 2008
1.083
-0.177
-14.06%
jan 1, 2009
0.875
-0.208
-19.2%
jan 1, 2010
0.614
-0.261
-29.83%
jan 1, 2011
0.602
-0.012
-1.93%
jan 1, 2012
0.981
+0.379
62.97%
jan 1, 2013
1.333
+0.352
35.92%
jan 1, 2014
1.431
+0.098
7.33%
jan 1, 2015
1.424
-0.006
-0.45%
Ranking of countries by current statistics by years


Comments: