29
/
en
AIzaSyAYiBZKx7MnpbEhh9jyipgxe19OcubqV5w
April 1, 2024
113876
Cote d'Ivoire
CIV
true
2
1
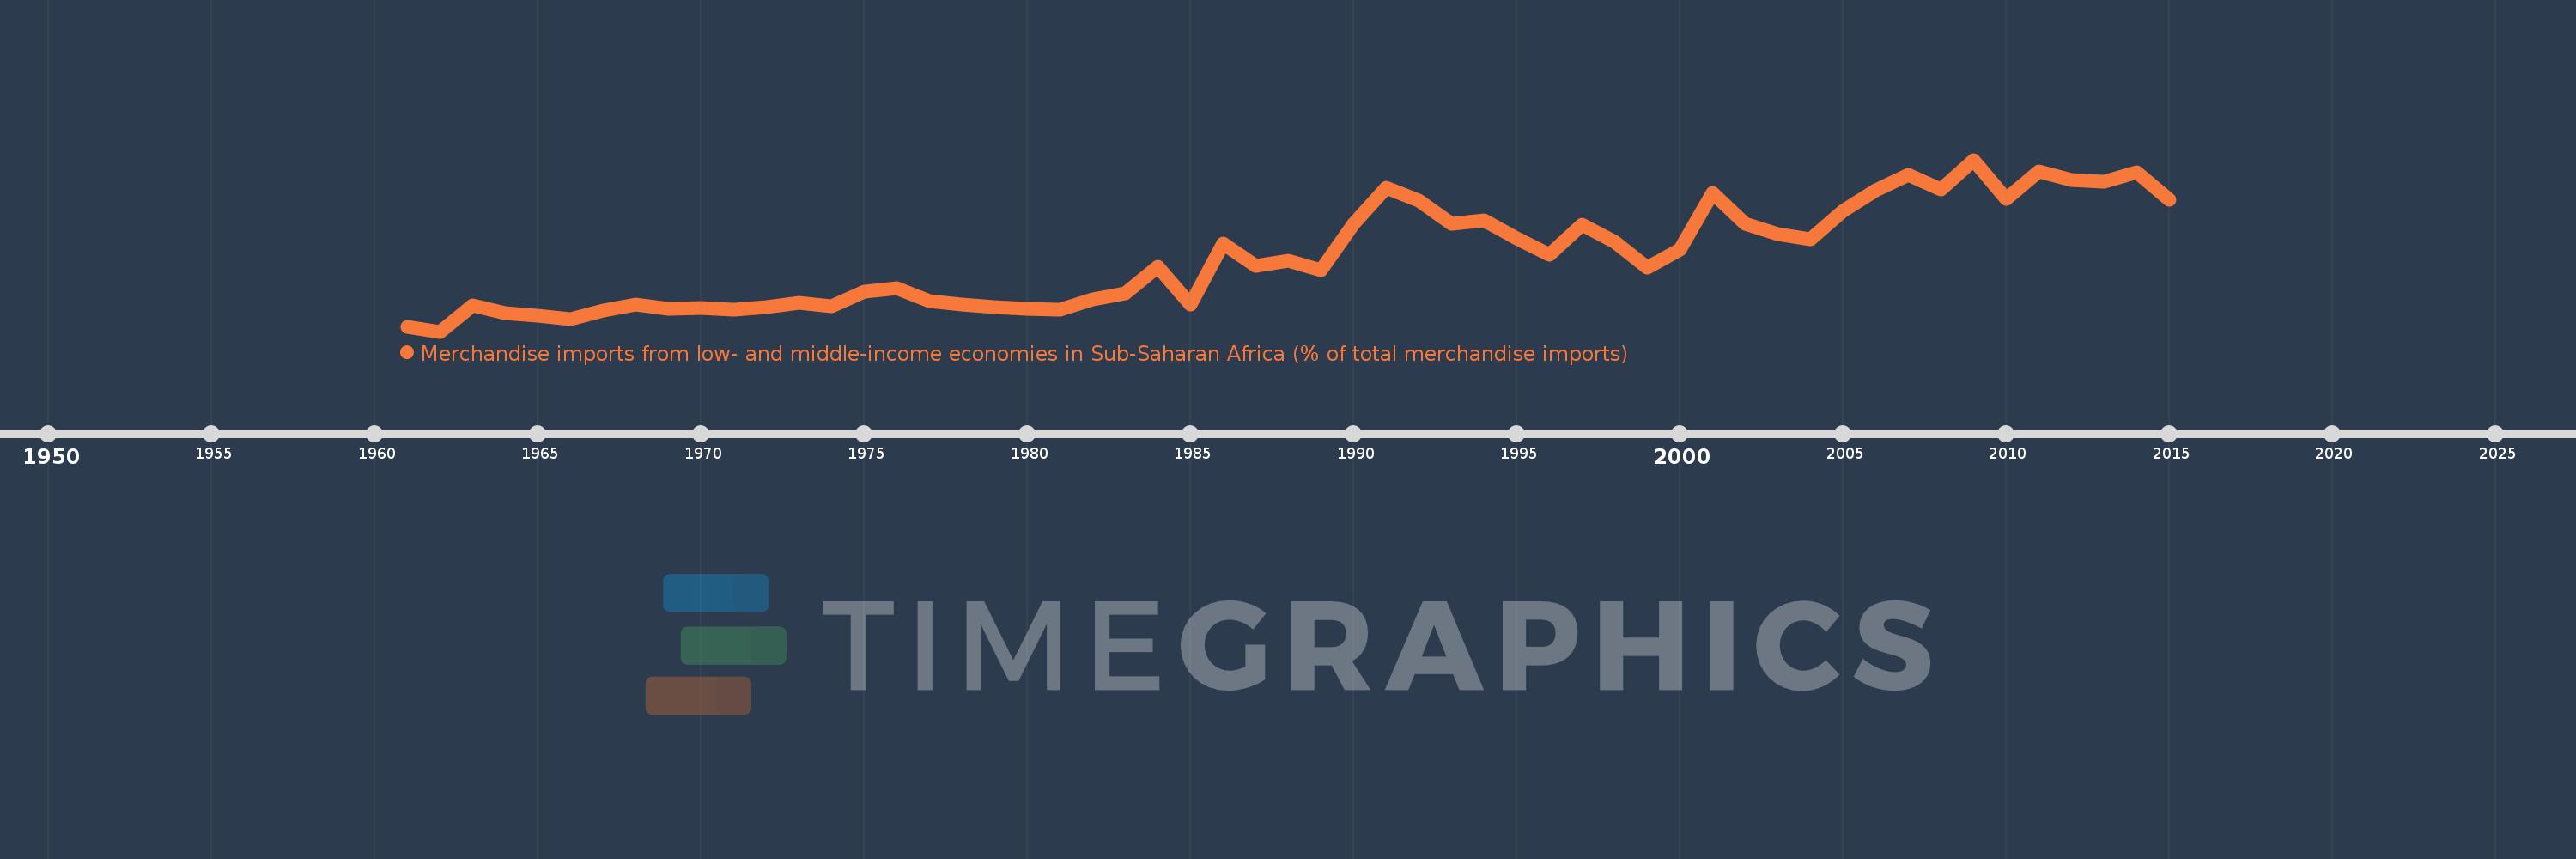
Merchandise imports from low- and middle-income economies in Sub-Saharan Africa (% of total merchandise imports)
2015,2014,2013,2012,2011,2010,2009,2008,2007,2006,2005,2004,2003,2002,2001,2000,1999,1998,1997,1996,1995,1994,1993,1992,1991,1990,1989,1988,1987,1986,1985,1984,1983,1982,1981,1980,1979,1978,1977,1976,1975,1974,1973,1972,1971,1970,1969,1968,1967,1966,1965,1964,1963,1962,1961
This statistics in other country:
AlbaniaAlgeriaAngolaArab WorldArgentinaArmeniaArubaAustraliaAustriaAzerbaijanBahamas, TheBahrainBangladeshBarbadosBelarusBelgiumBelizeBeninBermudaBoliviaBrazilBrunei DarussalamBulgariaBurkina FasoBurundiCabo VerdeCambodiaCameroonCanadaCaribbean small statesCentral African RepublicCentral Europe and the BalticsChadChileChinaColombiaCongo, Dem. Rep.Congo, Rep.Costa RicaCote d'IvoireCroatiaCubaCyprusCzech RepublicDenmarkDjiboutiDominicaDominican RepublicEarly-demographic dividendEast Asia & PacificEast Asia & Pacific (excluding high income)East Asia & Pacific (IDA & IBRD countries)EcuadorEgypt, Arab Rep.El SalvadorEstoniaEthiopiaEuro areaEurope & Central AsiaEurope & Central Asia (excluding high income)Europe & Central Asia (IDA & IBRD countries)European UnionFijiFinlandFragile and conflict affected situationsFranceGabonGambia, TheGeorgiaGermanyGhanaGreeceGreenlandGrenadaGuatemalaGuineaGuinea-BissauGuyanaHaitiHeavily indebted poor countries (HIPC)High incomeHondurasHong Kong SAR, ChinaHungaryIBRD onlyIcelandIDA & IBRD totalIDA blendIDA onlyIDA totalIndiaIndonesiaIran, Islamic Rep.IraqIrelandIsraelItalyJamaicaJapanJordanKazakhstanKenyaKorea, Dem. People’s Rep.Korea, Rep.KuwaitLao PDRLate-demographic dividendLatin America & Caribbean Latin America & Caribbean (excluding high income)Latin America & the Caribbean (IDA & IBRD countries)LatviaLeast developed countries: UN classificationLebanonLiberiaLibyaLithuaniaLow & middle incomeLow incomeLower middle incomeLuxembourgMacao SAR, ChinaMacedonia, FYRMadagascarMalawiMalaysiaMaliMaltaMauritaniaMauritiusMexicoMiddle East & North AfricaMiddle East & North Africa (excluding high income)Middle East & North Africa (IDA & IBRD countries)Middle incomeMoldovaMontenegroMoroccoMozambiqueMyanmarNetherlandsNew CaledoniaNew ZealandNicaraguaNigerNigeriaNorth AmericaNorwayOECD membersOmanOther small statesPacific island small statesPakistanPanamaPapua New GuineaParaguayPeruPhilippinesPolandPortugalPost-demographic dividendPre-demographic dividendQatarRomaniaRussian FederationRwandaSaudi ArabiaSenegalSerbiaSeychellesSierra LeoneSingaporeSlovak RepublicSloveniaSmall statesSomaliaSouth AfricaSouth AsiaSouth Asia (IDA & IBRD)SpainSri LankaSt. LuciaSt. Vincent and the GrenadinesSub-Saharan Africa Sub-Saharan Africa (excluding high income)Sub-Saharan Africa (IDA & IBRD countries)SudanSurinameSwedenSwitzerlandSyrian Arab RepublicTanzaniaThailandTogoTrinidad and TobagoTunisiaTurkeyUgandaUkraineUnited Arab EmiratesUnited KingdomUnited StatesUpper middle incomeUruguayVenezuela, RBVietnamWorldYemen, Rep.ZambiaZimbabwe Timeline:
This timeline shows a graph from 1961 to 2015 of Cote d'Ivoire. No data until 1960. Number of actual observations by date: 55.
Source name:
World Development Indicators
Source organization:
World Bank staff estimates based data from International Monetary Fund's Direction of Trade database.
Categories, topics:
Private Sector, Trade
Last updated:
apr 23, 2017
Indicators value changes by year
Maximum:
34.609
jan 1, 2009
At the date of observation
Value
Absolute change
Change from previous value
jan 1, 1961
1.584
+1.584
0.0%
jan 1, 1962
0.579
-1.005
-63.45%
jan 1, 1963
5.826
+5.247
905.93%
jan 1, 1964
4.179
-1.647
-28.27%
jan 1, 1965
3.763
-0.416
-9.96%
jan 1, 1966
3.01
-0.753
-20.01%
jan 1, 1967
4.775
+1.765
58.65%
jan 1, 1968
5.9
+1.125
23.56%
jan 1, 1969
5.072
-0.828
-14.04%
jan 1, 1970
5.285
+0.213
4.2%
jan 1, 1971
4.932
-0.352
-6.67%
jan 1, 1972
5.455
+0.523
10.6%
jan 1, 1973
6.331
+0.876
16.06%
jan 1, 1974
5.599
-0.732
-11.56%
jan 1, 1975
8.406
+2.807
50.13%
jan 1, 1976
9.228
+0.821
9.77%
jan 1, 1977
6.562
-2.666
-28.89%
jan 1, 1978
5.945
-0.616
-9.39%
jan 1, 1979
5.423
-0.522
-8.78%
jan 1, 1980
5.041
-0.382
-7.05%
jan 1, 1981
4.86
-0.181
-3.6%
jan 1, 1982
7.014
+2.154
44.33%
jan 1, 1983
8.082
+1.068
15.22%
jan 1, 1984
13.479
+5.398
66.79%
jan 1, 1985
5.937
-7.543
-55.96%
jan 1, 1986
18.037
+12.101
203.83%
jan 1, 1987
13.58
-4.457
-24.71%
jan 1, 1988
14.547
+0.966
7.12%
jan 1, 1989
12.776
-1.771
-12.18%
jan 1, 1990
21.849
+9.073
71.01%
jan 1, 1991
29.103
+7.254
33.2%
jan 1, 1992
26.576
-2.526
-8.68%
jan 1, 1993
21.995
-4.581
-17.24%
jan 1, 1994
22.577
+0.582
2.65%
jan 1, 1995
19.08
-3.497
-15.49%
jan 1, 1996
15.782
-3.297
-17.28%
jan 1, 1997
21.82
+6.038
38.26%
jan 1, 1998
18.368
-3.452
-15.82%
jan 1, 1999
13.289
-5.079
-27.65%
jan 1, 2000
16.773
+3.484
26.22%
jan 1, 2001
28.061
+11.288
67.3%
jan 1, 2002
21.984
-6.076
-21.65%
jan 1, 2003
19.928
-2.057
-9.36%
jan 1, 2004
18.793
-1.135
-5.7%
jan 1, 2005
24.421
+5.628
29.95%
jan 1, 2006
28.509
+4.088
16.74%
jan 1, 2007
31.697
+3.187
11.18%
jan 1, 2008
28.715
-2.982
-9.41%
jan 1, 2009
34.609
+5.895
20.53%
jan 1, 2010
26.8
-7.81
-22.57%
jan 1, 2011
32.247
+5.447
20.33%
jan 1, 2012
30.68
-1.568
-4.86%
jan 1, 2013
30.269
-0.411
-1.34%
jan 1, 2014
32.063
+1.794
5.93%
jan 1, 2015
26.745
-5.318
-16.59%
Ranking of countries by current statistics by years


Comments: