29
/
en
AIzaSyAYiBZKx7MnpbEhh9jyipgxe19OcubqV5w
April 1, 2024
70112
Argentina
ARG
true
2
1
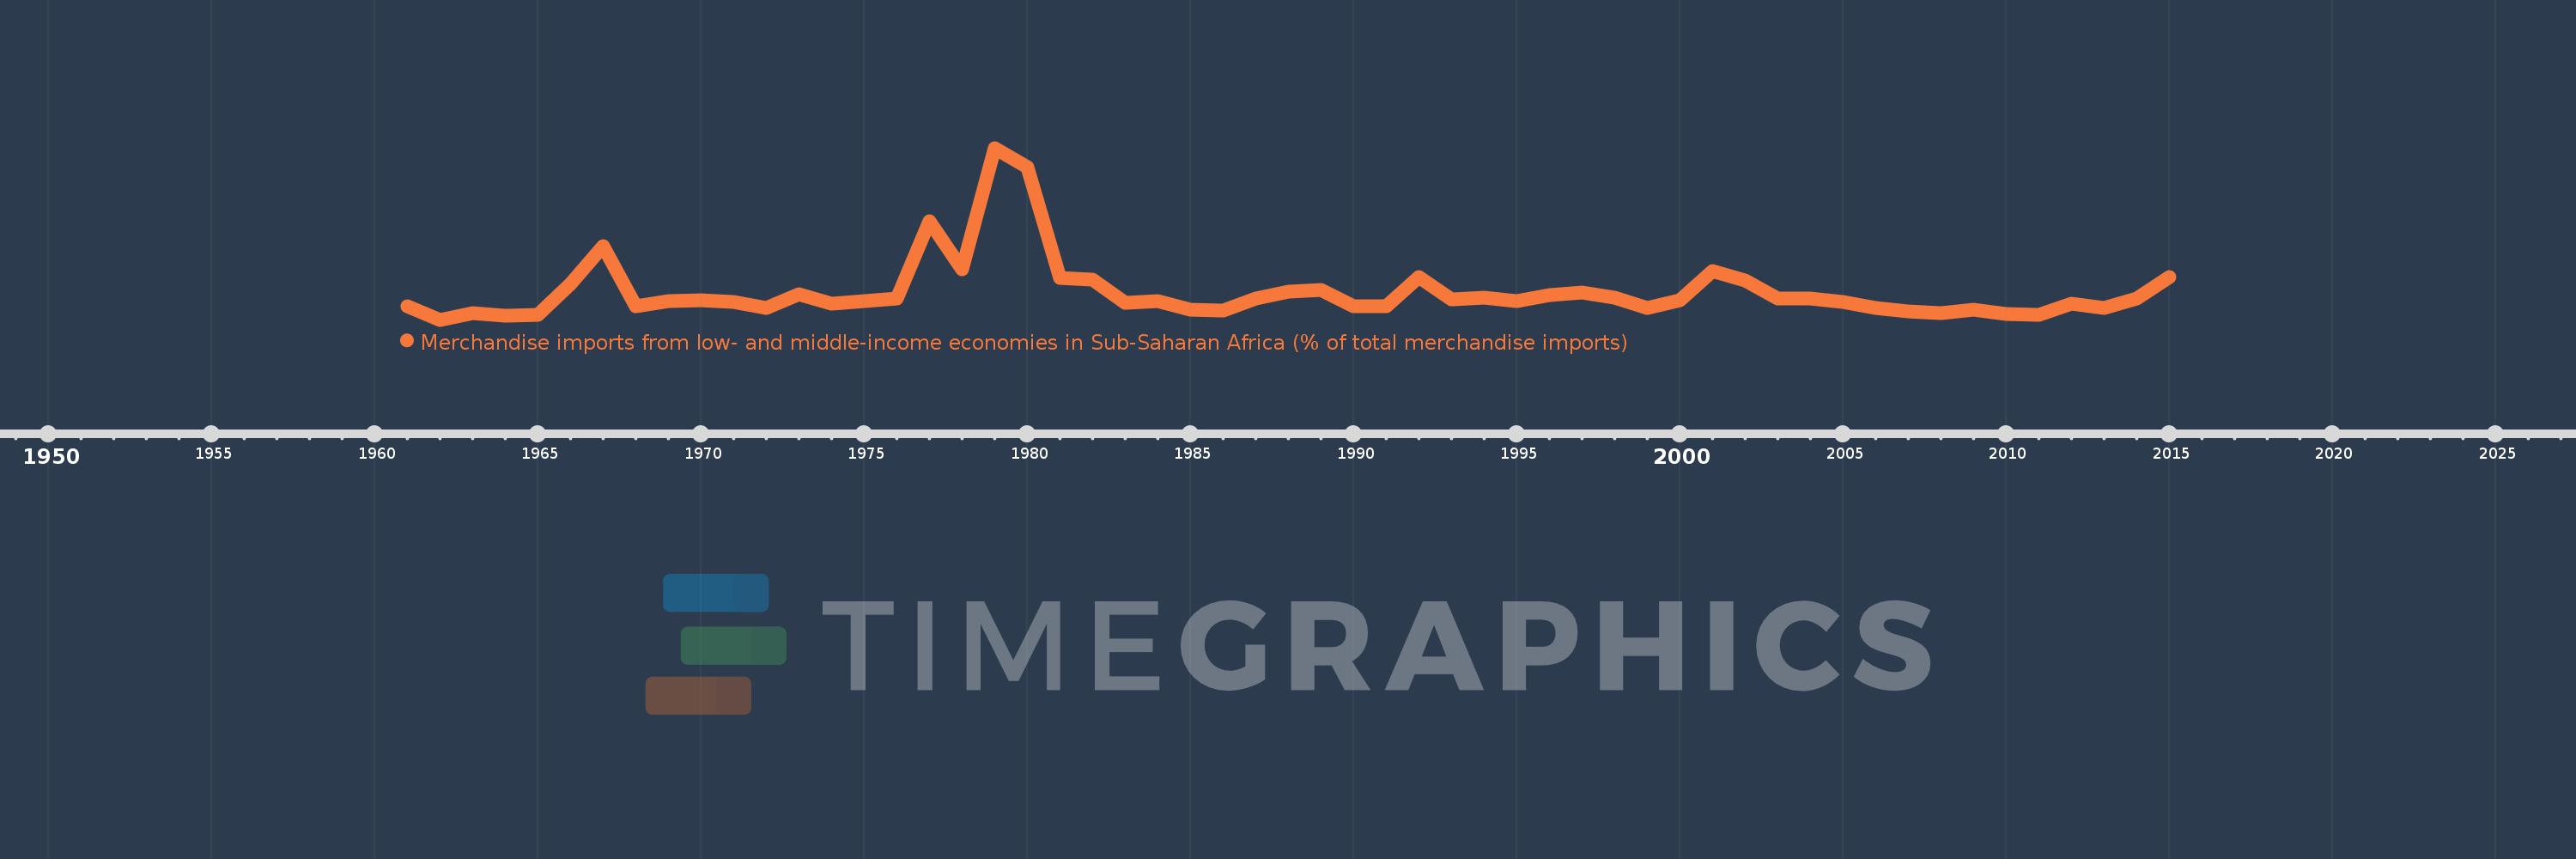
Merchandise imports from low- and middle-income economies in Sub-Saharan Africa (% of total merchandise imports)
2015,2014,2013,2012,2011,2010,2009,2008,2007,2006,2005,2004,2003,2002,2001,2000,1999,1998,1997,1996,1995,1994,1993,1992,1991,1990,1989,1988,1987,1986,1985,1984,1983,1982,1981,1980,1979,1978,1977,1976,1975,1974,1973,1972,1971,1970,1969,1968,1967,1966,1965,1964,1963,1962,1961
This statistics in other country:
AlbaniaAlgeriaAngolaArab WorldArgentinaArmeniaArubaAustraliaAustriaAzerbaijanBahamas, TheBahrainBangladeshBarbadosBelarusBelgiumBelizeBeninBermudaBoliviaBrazilBrunei DarussalamBulgariaBurkina FasoBurundiCabo VerdeCambodiaCameroonCanadaCaribbean small statesCentral African RepublicCentral Europe and the BalticsChadChileChinaColombiaCongo, Dem. Rep.Congo, Rep.Costa RicaCote d'IvoireCroatiaCubaCyprusCzech RepublicDenmarkDjiboutiDominicaDominican RepublicEarly-demographic dividendEast Asia & PacificEast Asia & Pacific (excluding high income)East Asia & Pacific (IDA & IBRD countries)EcuadorEgypt, Arab Rep.El SalvadorEstoniaEthiopiaEuro areaEurope & Central AsiaEurope & Central Asia (excluding high income)Europe & Central Asia (IDA & IBRD countries)European UnionFijiFinlandFragile and conflict affected situationsFranceGabonGambia, TheGeorgiaGermanyGhanaGreeceGreenlandGrenadaGuatemalaGuineaGuinea-BissauGuyanaHaitiHeavily indebted poor countries (HIPC)High incomeHondurasHong Kong SAR, ChinaHungaryIBRD onlyIcelandIDA & IBRD totalIDA blendIDA onlyIDA totalIndiaIndonesiaIran, Islamic Rep.IraqIrelandIsraelItalyJamaicaJapanJordanKazakhstanKenyaKorea, Dem. People’s Rep.Korea, Rep.KuwaitLao PDRLate-demographic dividendLatin America & Caribbean Latin America & Caribbean (excluding high income)Latin America & the Caribbean (IDA & IBRD countries)LatviaLeast developed countries: UN classificationLebanonLiberiaLibyaLithuaniaLow & middle incomeLow incomeLower middle incomeLuxembourgMacao SAR, ChinaMacedonia, FYRMadagascarMalawiMalaysiaMaliMaltaMauritaniaMauritiusMexicoMiddle East & North AfricaMiddle East & North Africa (excluding high income)Middle East & North Africa (IDA & IBRD countries)Middle incomeMoldovaMontenegroMoroccoMozambiqueMyanmarNetherlandsNew CaledoniaNew ZealandNicaraguaNigerNigeriaNorth AmericaNorwayOECD membersOmanOther small statesPacific island small statesPakistanPanamaPapua New GuineaParaguayPeruPhilippinesPolandPortugalPost-demographic dividendPre-demographic dividendQatarRomaniaRussian FederationRwandaSaudi ArabiaSenegalSerbiaSeychellesSierra LeoneSingaporeSlovak RepublicSloveniaSmall statesSomaliaSouth AfricaSouth AsiaSouth Asia (IDA & IBRD)SpainSri LankaSt. LuciaSt. Vincent and the GrenadinesSub-Saharan Africa Sub-Saharan Africa (excluding high income)Sub-Saharan Africa (IDA & IBRD countries)SudanSurinameSwedenSwitzerlandSyrian Arab RepublicTanzaniaThailandTogoTrinidad and TobagoTunisiaTurkeyUgandaUkraineUnited Arab EmiratesUnited KingdomUnited StatesUpper middle incomeUruguayVenezuela, RBVietnamWorldYemen, Rep.ZambiaZimbabwe Timeline:
This timeline shows a graph from 1961 to 2015 of Argentina. No data until 1960. Number of actual observations by date: 55.
Source name:
World Development Indicators
Source organization:
World Bank staff estimates based data from International Monetary Fund's Direction of Trade database.
Categories, topics:
Private Sector, Trade
Last updated:
apr 23, 2017
Indicators value changes by year
At the date of observation
Value
Absolute change
Change from previous value
jan 1, 1961
0.497
+0.497
0.0%
jan 1, 1962
0.13
-0.367
-73.82%
jan 1, 1963
0.304
+0.174
133.94%
jan 1, 1964
0.247
-0.057
-18.76%
jan 1, 1965
0.274
+0.027
10.99%
jan 1, 1966
1.111
+0.837
304.97%
jan 1, 1967
2.143
+1.032
92.82%
jan 1, 1968
0.493
-1.65
-77.0%
jan 1, 1969
0.641
+0.148
30.1%
jan 1, 1970
0.67
+0.029
4.48%
jan 1, 1971
0.611
-0.059
-8.83%
jan 1, 1972
0.446
-0.165
-26.96%
jan 1, 1973
0.826
+0.38
85.13%
jan 1, 1974
0.571
-0.255
-30.91%
jan 1, 1975
0.635
+0.064
11.21%
jan 1, 1976
0.721
+0.086
13.54%
jan 1, 1977
2.823
+2.103
291.81%
jan 1, 1978
1.498
-1.325
-46.94%
jan 1, 1979
4.824
+3.326
222.08%
jan 1, 1980
4.31
-0.514
-10.66%
jan 1, 1981
1.264
-3.046
-70.67%
jan 1, 1982
1.216
-0.048
-3.8%
jan 1, 1983
0.604
-0.613
-50.37%
jan 1, 1984
0.648
+0.044
7.33%
jan 1, 1985
0.397
-0.25
-38.66%
jan 1, 1986
0.39
-0.008
-1.9%
jan 1, 1987
0.699
+0.31
79.4%
jan 1, 1988
0.887
+0.187
26.77%
jan 1, 1989
0.951
+0.065
7.31%
jan 1, 1990
0.492
-0.459
-48.27%
jan 1, 1991
0.506
+0.014
2.88%
jan 1, 1992
1.299
+0.793
156.61%
jan 1, 1993
0.687
-0.612
-47.13%
jan 1, 1994
0.727
+0.04
5.87%
jan 1, 1995
0.639
-0.088
-12.08%
jan 1, 1996
0.798
+0.159
24.81%
jan 1, 1997
0.882
+0.084
10.52%
jan 1, 1998
0.723
-0.159
-18.07%
jan 1, 1999
0.441
-0.282
-39.0%
jan 1, 2000
0.662
+0.221
50.17%
jan 1, 2001
1.45
+0.788
119.02%
jan 1, 2002
1.197
-0.252
-17.42%
jan 1, 2003
0.719
-0.478
-39.95%
jan 1, 2004
0.714
-0.005
-0.71%
jan 1, 2005
0.622
-0.092
-12.87%
jan 1, 2006
0.462
-0.16
-25.66%
jan 1, 2007
0.368
-0.094
-20.41%
jan 1, 2008
0.31
-0.058
-15.87%
jan 1, 2009
0.411
+0.101
32.66%
jan 1, 2010
0.285
-0.126
-30.67%
jan 1, 2011
0.269
-0.016
-5.5%
jan 1, 2012
0.573
+0.304
113.08%
jan 1, 2013
0.461
-0.112
-19.54%
jan 1, 2014
0.711
+0.25
54.22%
jan 1, 2015
1.297
+0.586
82.32%
Ranking of countries by current statistics by years


Comments: