29
/
en
AIzaSyAYiBZKx7MnpbEhh9jyipgxe19OcubqV5w
April 1, 2024
42631
Latin America & Caribbean (excluding high income)
LAC
false
2
1
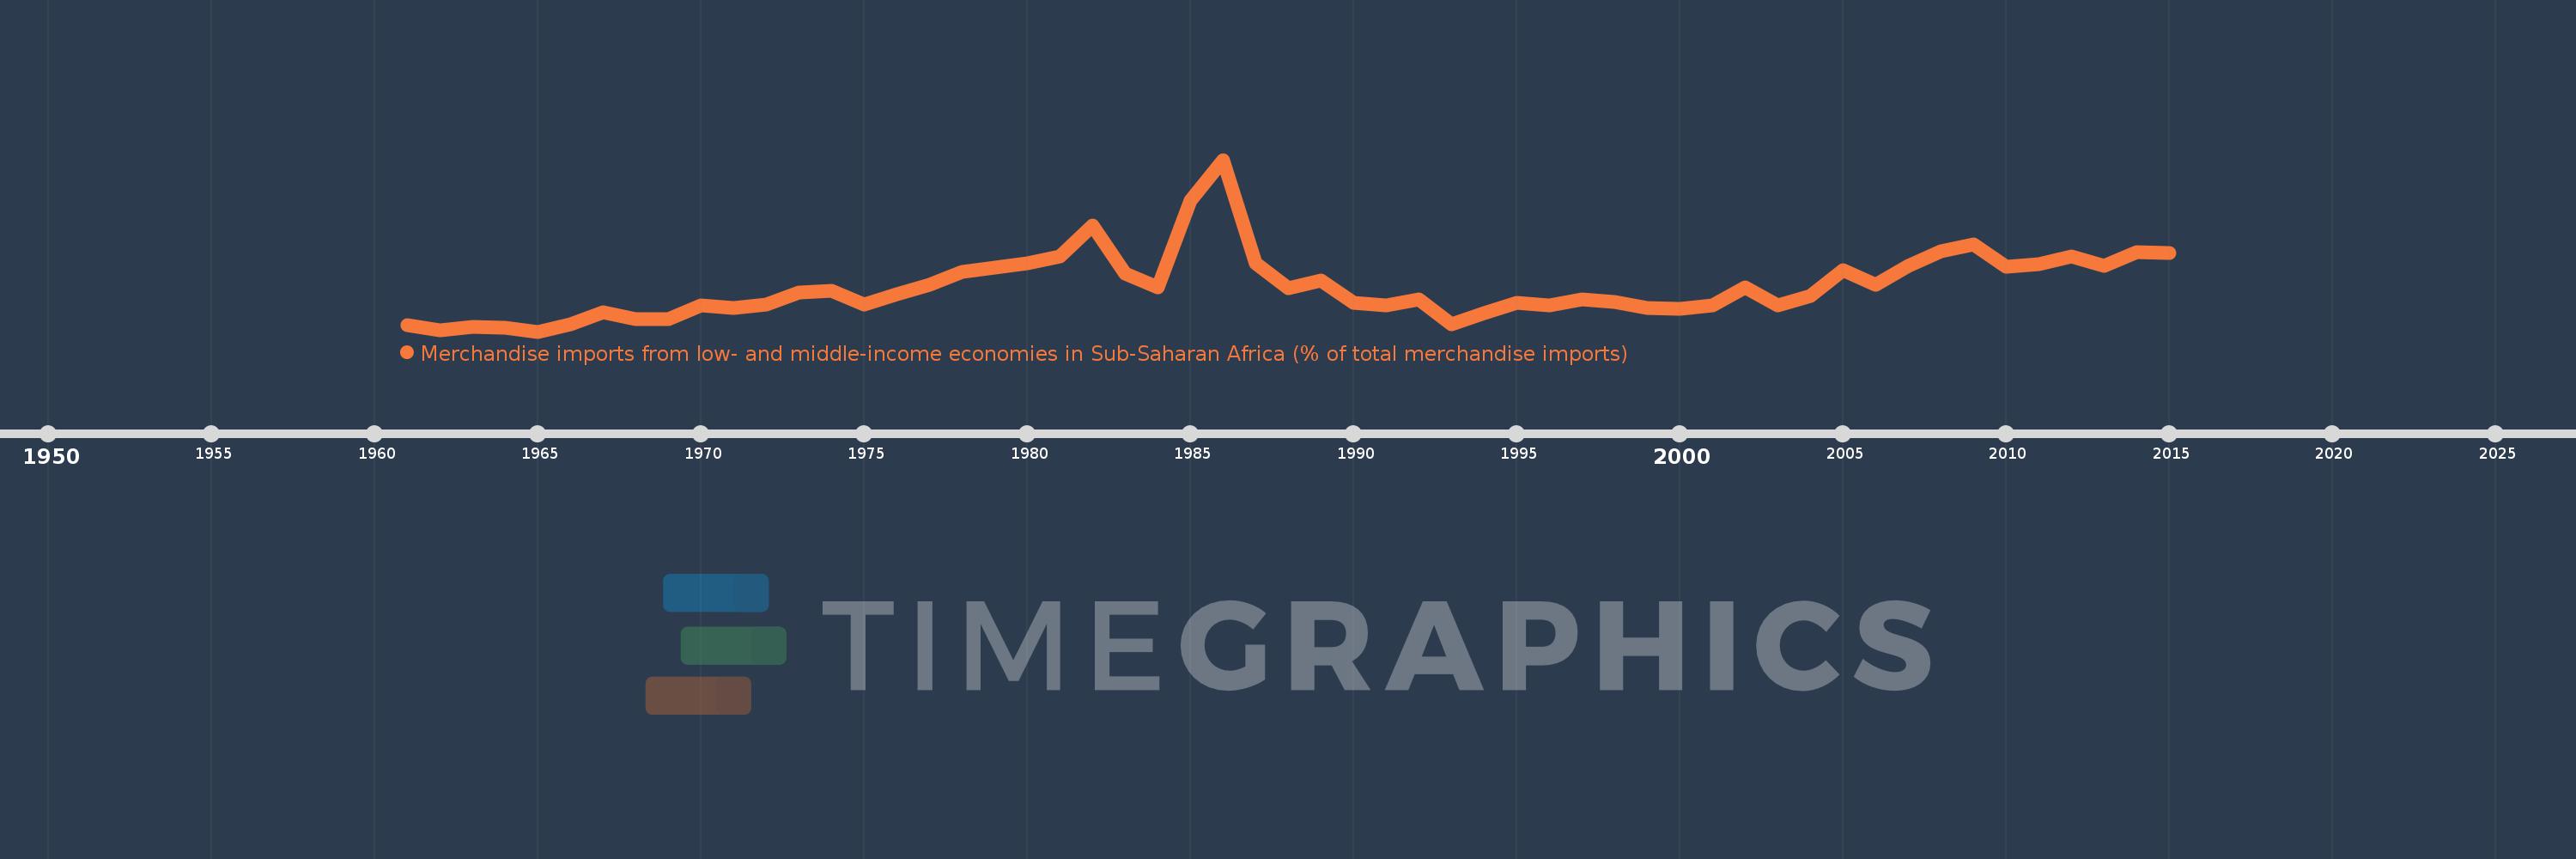
Merchandise imports from low- and middle-income economies in Sub-Saharan Africa (% of total merchandise imports)
2015,2014,2013,2012,2011,2010,2009,2008,2007,2006,2005,2004,2003,2002,2001,2000,1999,1998,1997,1996,1995,1994,1993,1992,1991,1990,1989,1988,1987,1986,1985,1984,1983,1982,1981,1980,1979,1978,1977,1976,1975,1974,1973,1972,1971,1970,1969,1968,1967,1966,1965,1964,1963,1962,1961
This statistics in other country:
AlbaniaAlgeriaAngolaArab WorldArgentinaArmeniaArubaAustraliaAustriaAzerbaijanBahamas, TheBahrainBangladeshBarbadosBelarusBelgiumBelizeBeninBermudaBoliviaBrazilBrunei DarussalamBulgariaBurkina FasoBurundiCabo VerdeCambodiaCameroonCanadaCaribbean small statesCentral African RepublicCentral Europe and the BalticsChadChileChinaColombiaCongo, Dem. Rep.Congo, Rep.Costa RicaCote d'IvoireCroatiaCubaCyprusCzech RepublicDenmarkDjiboutiDominicaDominican RepublicEarly-demographic dividendEast Asia & PacificEast Asia & Pacific (excluding high income)East Asia & Pacific (IDA & IBRD countries)EcuadorEgypt, Arab Rep.El SalvadorEstoniaEthiopiaEuro areaEurope & Central AsiaEurope & Central Asia (excluding high income)Europe & Central Asia (IDA & IBRD countries)European UnionFijiFinlandFragile and conflict affected situationsFranceGabonGambia, TheGeorgiaGermanyGhanaGreeceGreenlandGrenadaGuatemalaGuineaGuinea-BissauGuyanaHaitiHeavily indebted poor countries (HIPC)High incomeHondurasHong Kong SAR, ChinaHungaryIBRD onlyIcelandIDA & IBRD totalIDA blendIDA onlyIDA totalIndiaIndonesiaIran, Islamic Rep.IraqIrelandIsraelItalyJamaicaJapanJordanKazakhstanKenyaKorea, Dem. People’s Rep.Korea, Rep.KuwaitLao PDRLate-demographic dividendLatin America & Caribbean Latin America & Caribbean (excluding high income)Latin America & the Caribbean (IDA & IBRD countries)LatviaLeast developed countries: UN classificationLebanonLiberiaLibyaLithuaniaLow & middle incomeLow incomeLower middle incomeLuxembourgMacao SAR, ChinaMacedonia, FYRMadagascarMalawiMalaysiaMaliMaltaMauritaniaMauritiusMexicoMiddle East & North AfricaMiddle East & North Africa (excluding high income)Middle East & North Africa (IDA & IBRD countries)Middle incomeMoldovaMontenegroMoroccoMozambiqueMyanmarNetherlandsNew CaledoniaNew ZealandNicaraguaNigerNigeriaNorth AmericaNorwayOECD membersOmanOther small statesPacific island small statesPakistanPanamaPapua New GuineaParaguayPeruPhilippinesPolandPortugalPost-demographic dividendPre-demographic dividendQatarRomaniaRussian FederationRwandaSaudi ArabiaSenegalSerbiaSeychellesSierra LeoneSingaporeSlovak RepublicSloveniaSmall statesSomaliaSouth AfricaSouth AsiaSouth Asia (IDA & IBRD)SpainSri LankaSt. LuciaSt. Vincent and the GrenadinesSub-Saharan Africa Sub-Saharan Africa (excluding high income)Sub-Saharan Africa (IDA & IBRD countries)SudanSurinameSwedenSwitzerlandSyrian Arab RepublicTanzaniaThailandTogoTrinidad and TobagoTunisiaTurkeyUgandaUkraineUnited Arab EmiratesUnited KingdomUnited StatesUpper middle incomeUruguayVenezuela, RBVietnamWorldYemen, Rep.ZambiaZimbabwe Timeline:
This timeline shows a graph from 1961 to 2015 of Latin America & Caribbean (excluding high income). No data until 1960. Number of actual observations by date: 55.
Source name:
World Development Indicators
Source organization:
World Bank staff estimates based data from International Monetary Fund's Direction of Trade database.
Categories, topics:
Private Sector, Trade
Last updated:
apr 23, 2017
Indicators value changes by year
At the date of observation
Value
Absolute change
Change from previous value
jan 1, 1961
0.225
+0.225
0.0%
jan 1, 1962
0.143
-0.082
-36.3%
jan 1, 1963
0.196
+0.052
36.59%
jan 1, 1964
0.183
-0.013
-6.69%
jan 1, 1965
0.118
-0.064
-35.21%
jan 1, 1966
0.238
+0.12
101.3%
jan 1, 1967
0.438
+0.2
84.1%
jan 1, 1968
0.317
-0.122
-27.78%
jan 1, 1969
0.324
+0.008
2.5%
jan 1, 1970
0.547
+0.223
68.69%
jan 1, 1971
0.497
-0.05
-9.2%
jan 1, 1972
0.555
+0.058
11.59%
jan 1, 1973
0.748
+0.193
34.8%
jan 1, 1974
0.787
+0.04
5.3%
jan 1, 1975
0.564
-0.223
-28.31%
jan 1, 1976
0.728
+0.163
28.92%
jan 1, 1977
0.886
+0.159
21.79%
jan 1, 1978
1.083
+0.197
22.25%
jan 1, 1979
1.164
+0.081
7.47%
jan 1, 1980
1.231
+0.066
5.69%
jan 1, 1981
1.345
+0.114
9.29%
jan 1, 1982
1.849
+0.504
37.49%
jan 1, 1983
1.061
-0.789
-42.65%
jan 1, 1984
0.843
-0.218
-20.54%
jan 1, 1985
2.249
+1.407
166.91%
jan 1, 1986
2.912
+0.663
29.48%
jan 1, 1987
1.228
-1.684
-57.83%
jan 1, 1988
0.822
-0.406
-33.08%
jan 1, 1989
0.949
+0.127
15.47%
jan 1, 1990
0.586
-0.363
-38.26%
jan 1, 1991
0.551
-0.035
-5.96%
jan 1, 1992
0.639
+0.088
16.0%
jan 1, 1993
0.23
-0.409
-63.98%
jan 1, 1994
0.416
+0.186
80.8%
jan 1, 1995
0.581
+0.165
39.65%
jan 1, 1996
0.551
-0.031
-5.28%
jan 1, 1997
0.642
+0.092
16.69%
jan 1, 1998
0.597
-0.046
-7.09%
jan 1, 1999
0.509
-0.088
-14.66%
jan 1, 2000
0.488
-0.021
-4.22%
jan 1, 2001
0.542
+0.054
11.08%
jan 1, 2002
0.834
+0.292
53.85%
jan 1, 2003
0.545
-0.289
-34.68%
jan 1, 2004
0.697
+0.152
27.97%
jan 1, 2005
1.112
+0.415
59.52%
jan 1, 2006
0.873
-0.238
-21.45%
jan 1, 2007
1.184
+0.311
35.56%
jan 1, 2008
1.424
+0.241
20.32%
jan 1, 2009
1.534
+0.11
7.71%
jan 1, 2010
1.176
-0.358
-23.34%
jan 1, 2011
1.215
+0.038
3.27%
jan 1, 2012
1.345
+0.131
10.75%
jan 1, 2013
1.189
-0.156
-11.6%
jan 1, 2014
1.415
+0.225
18.95%
jan 1, 2015
1.395
-0.019
-1.37%
Ranking of countries by current statistics by years


Comments: