29
/
en
AIzaSyAYiBZKx7MnpbEhh9jyipgxe19OcubqV5w
April 1, 2024
153800
Iceland
ISL
true
2
1
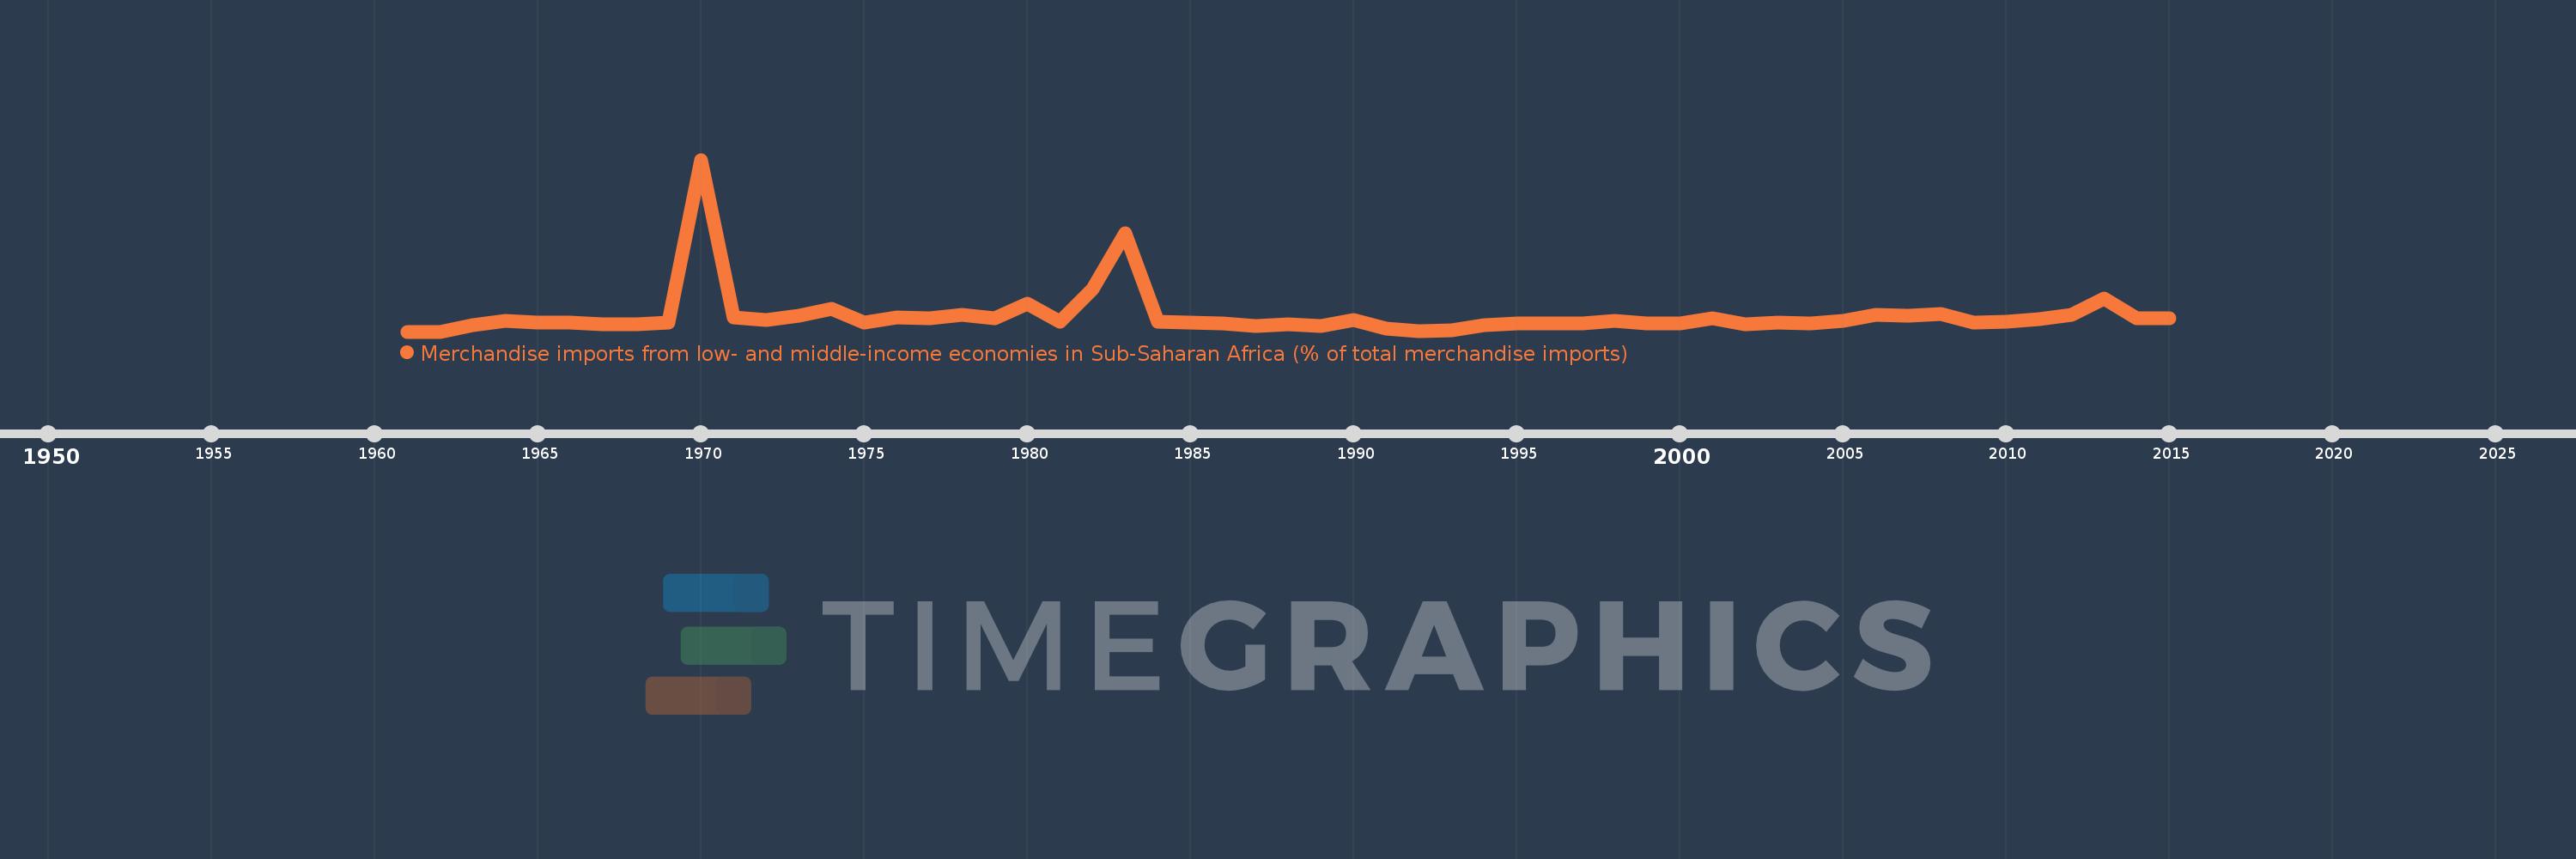
Merchandise imports from low- and middle-income economies in Sub-Saharan Africa (% of total merchandise imports)
2015,2014,2013,2012,2011,2010,2009,2008,2007,2006,2005,2004,2003,2002,2001,2000,1999,1998,1997,1996,1995,1994,1993,1992,1991,1990,1989,1988,1987,1986,1985,1984,1983,1982,1981,1980,1979,1978,1977,1976,1975,1974,1973,1972,1971,1970,1969,1968,1967,1966,1965,1964,1963,1962,1961
This statistics in other country:
AlbaniaAlgeriaAngolaArab WorldArgentinaArmeniaArubaAustraliaAustriaAzerbaijanBahamas, TheBahrainBangladeshBarbadosBelarusBelgiumBelizeBeninBermudaBoliviaBrazilBrunei DarussalamBulgariaBurkina FasoBurundiCabo VerdeCambodiaCameroonCanadaCaribbean small statesCentral African RepublicCentral Europe and the BalticsChadChileChinaColombiaCongo, Dem. Rep.Congo, Rep.Costa RicaCote d'IvoireCroatiaCubaCyprusCzech RepublicDenmarkDjiboutiDominicaDominican RepublicEarly-demographic dividendEast Asia & PacificEast Asia & Pacific (excluding high income)East Asia & Pacific (IDA & IBRD countries)EcuadorEgypt, Arab Rep.El SalvadorEstoniaEthiopiaEuro areaEurope & Central AsiaEurope & Central Asia (excluding high income)Europe & Central Asia (IDA & IBRD countries)European UnionFijiFinlandFragile and conflict affected situationsFranceGabonGambia, TheGeorgiaGermanyGhanaGreeceGreenlandGrenadaGuatemalaGuineaGuinea-BissauGuyanaHaitiHeavily indebted poor countries (HIPC)High incomeHondurasHong Kong SAR, ChinaHungaryIBRD onlyIcelandIDA & IBRD totalIDA blendIDA onlyIDA totalIndiaIndonesiaIran, Islamic Rep.IraqIrelandIsraelItalyJamaicaJapanJordanKazakhstanKenyaKorea, Dem. People’s Rep.Korea, Rep.KuwaitLao PDRLate-demographic dividendLatin America & Caribbean Latin America & Caribbean (excluding high income)Latin America & the Caribbean (IDA & IBRD countries)LatviaLeast developed countries: UN classificationLebanonLiberiaLibyaLithuaniaLow & middle incomeLow incomeLower middle incomeLuxembourgMacao SAR, ChinaMacedonia, FYRMadagascarMalawiMalaysiaMaliMaltaMauritaniaMauritiusMexicoMiddle East & North AfricaMiddle East & North Africa (excluding high income)Middle East & North Africa (IDA & IBRD countries)Middle incomeMoldovaMontenegroMoroccoMozambiqueMyanmarNetherlandsNew CaledoniaNew ZealandNicaraguaNigerNigeriaNorth AmericaNorwayOECD membersOmanOther small statesPacific island small statesPakistanPanamaPapua New GuineaParaguayPeruPhilippinesPolandPortugalPost-demographic dividendPre-demographic dividendQatarRomaniaRussian FederationRwandaSaudi ArabiaSenegalSerbiaSeychellesSierra LeoneSingaporeSlovak RepublicSloveniaSmall statesSomaliaSouth AfricaSouth AsiaSouth Asia (IDA & IBRD)SpainSri LankaSt. LuciaSt. Vincent and the GrenadinesSub-Saharan Africa Sub-Saharan Africa (excluding high income)Sub-Saharan Africa (IDA & IBRD countries)SudanSurinameSwedenSwitzerlandSyrian Arab RepublicTanzaniaThailandTogoTrinidad and TobagoTunisiaTurkeyUgandaUkraineUnited Arab EmiratesUnited KingdomUnited StatesUpper middle incomeUruguayVenezuela, RBVietnamWorldYemen, Rep.ZambiaZimbabwe Timeline:
This timeline shows a graph from 1961 to 2015 of Iceland. No data until 1960. Number of actual observations by date: 55.
Source name:
World Development Indicators
Source organization:
World Bank staff estimates based data from International Monetary Fund's Direction of Trade database.
Categories, topics:
Private Sector, Trade
Last updated:
apr 23, 2017
Indicators value changes by year
At the date of observation
Value
Absolute change
Change from previous value
jan 1, 1963
0.112
+0.112
%
jan 1, 1964
0.183
+0.071
63.15%
jan 1, 1965
0.153
-0.03
-16.53%
jan 1, 1966
0.146
-0.007
-4.81%
jan 1, 1967
0.126
-0.02
-13.76%
jan 1, 1968
0.124
-0.002
-1.42%
jan 1, 1969
0.146
+0.022
17.71%
jan 1, 1970
2.83
+2.685
1.84K%
jan 1, 1971
0.234
-2.596
-91.73%
jan 1, 1972
0.19
-0.044
-18.63%
jan 1, 1973
0.257
+0.066
34.84%
jan 1, 1974
0.381
+0.124
48.25%
jan 1, 1975
0.152
-0.228
-60.04%
jan 1, 1976
0.231
+0.079
52.23%
jan 1, 1977
0.222
-0.009
-4.1%
jan 1, 1978
0.272
+0.05
22.71%
jan 1, 1979
0.222
-0.05
-18.45%
jan 1, 1980
0.46
+0.238
107.31%
jan 1, 1981
0.16
-0.3
-65.18%
jan 1, 1982
0.7
+0.54
336.44%
jan 1, 1983
1.626
+0.926
132.32%
jan 1, 1984
0.158
-1.468
-90.3%
jan 1, 1985
0.142
-0.015
-9.8%
jan 1, 1986
0.129
-0.013
-9.1%
jan 1, 1987
0.086
-0.043
-33.4%
jan 1, 1988
0.122
+0.036
41.96%
jan 1, 1989
0.094
-0.028
-23.17%
jan 1, 1990
0.198
+0.104
110.57%
jan 1, 1991
0.043
-0.155
-78.12%
jan 1, 1992
0.009
-0.035
-80.14%
jan 1, 1993
0.015
+0.006
71.09%
jan 1, 1994
0.104
+0.09
609.57%
jan 1, 1995
0.132
+0.027
26.23%
jan 1, 1996
0.13
-0.001
-1.13%
jan 1, 1997
0.134
+0.004
3.08%
jan 1, 1998
0.175
+0.041
30.27%
jan 1, 1999
0.135
-0.04
-22.96%
jan 1, 2000
0.132
-0.002
-1.72%
jan 1, 2001
0.222
+0.089
67.55%
jan 1, 2002
0.125
-0.096
-43.47%
jan 1, 2003
0.151
+0.025
20.16%
jan 1, 2004
0.141
-0.01
-6.8%
jan 1, 2005
0.172
+0.032
22.5%
jan 1, 2006
0.274
+0.102
59.2%
jan 1, 2007
0.268
-0.006
-2.27%
jan 1, 2008
0.294
+0.026
9.66%
jan 1, 2009
0.151
-0.142
-48.42%
jan 1, 2010
0.164
+0.012
8.03%
jan 1, 2011
0.205
+0.041
24.96%
jan 1, 2012
0.27
+0.066
32.12%
jan 1, 2013
0.544
+0.274
101.36%
jan 1, 2014
0.22
-0.324
-59.58%
jan 1, 2015
0.226
+0.006
2.75%
Ranking of countries by current statistics by years


Comments: