29
/
en
AIzaSyAYiBZKx7MnpbEhh9jyipgxe19OcubqV5w
April 1, 2024
125095
Egypt, Arab Rep.
EGY
true
2
1
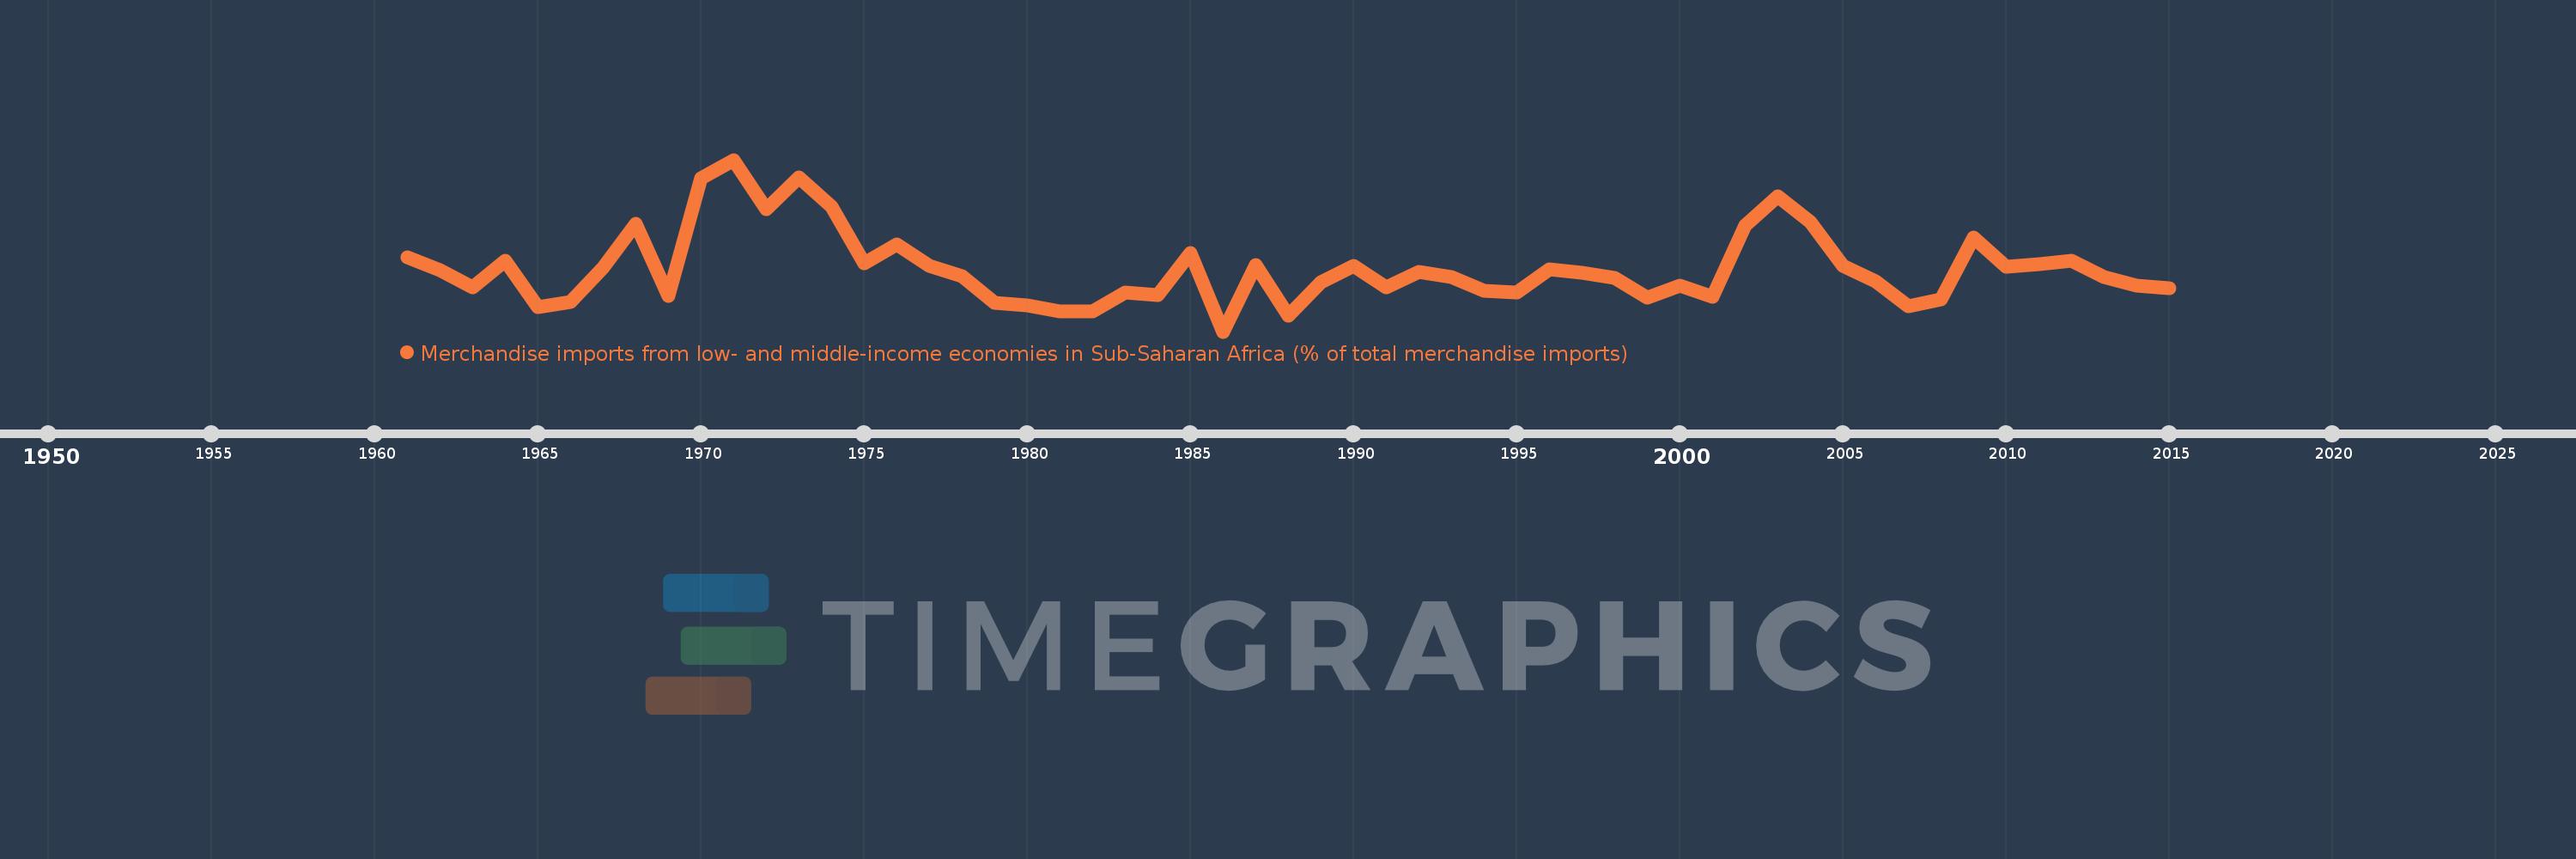
Merchandise imports from low- and middle-income economies in Sub-Saharan Africa (% of total merchandise imports)
2015,2014,2013,2012,2011,2010,2009,2008,2007,2006,2005,2004,2003,2002,2001,2000,1999,1998,1997,1996,1995,1994,1993,1992,1991,1990,1989,1988,1987,1986,1985,1984,1983,1982,1981,1980,1979,1978,1977,1976,1975,1974,1973,1972,1971,1970,1969,1968,1967,1966,1965,1964,1963,1962,1961
This statistics in other country:
AlbaniaAlgeriaAngolaArab WorldArgentinaArmeniaArubaAustraliaAustriaAzerbaijanBahamas, TheBahrainBangladeshBarbadosBelarusBelgiumBelizeBeninBermudaBoliviaBrazilBrunei DarussalamBulgariaBurkina FasoBurundiCabo VerdeCambodiaCameroonCanadaCaribbean small statesCentral African RepublicCentral Europe and the BalticsChadChileChinaColombiaCongo, Dem. Rep.Congo, Rep.Costa RicaCote d'IvoireCroatiaCubaCyprusCzech RepublicDenmarkDjiboutiDominicaDominican RepublicEarly-demographic dividendEast Asia & PacificEast Asia & Pacific (excluding high income)East Asia & Pacific (IDA & IBRD countries)EcuadorEgypt, Arab Rep.El SalvadorEstoniaEthiopiaEuro areaEurope & Central AsiaEurope & Central Asia (excluding high income)Europe & Central Asia (IDA & IBRD countries)European UnionFijiFinlandFragile and conflict affected situationsFranceGabonGambia, TheGeorgiaGermanyGhanaGreeceGreenlandGrenadaGuatemalaGuineaGuinea-BissauGuyanaHaitiHeavily indebted poor countries (HIPC)High incomeHondurasHong Kong SAR, ChinaHungaryIBRD onlyIcelandIDA & IBRD totalIDA blendIDA onlyIDA totalIndiaIndonesiaIran, Islamic Rep.IraqIrelandIsraelItalyJamaicaJapanJordanKazakhstanKenyaKorea, Dem. People’s Rep.Korea, Rep.KuwaitLao PDRLate-demographic dividendLatin America & Caribbean Latin America & Caribbean (excluding high income)Latin America & the Caribbean (IDA & IBRD countries)LatviaLeast developed countries: UN classificationLebanonLiberiaLibyaLithuaniaLow & middle incomeLow incomeLower middle incomeLuxembourgMacao SAR, ChinaMacedonia, FYRMadagascarMalawiMalaysiaMaliMaltaMauritaniaMauritiusMexicoMiddle East & North AfricaMiddle East & North Africa (excluding high income)Middle East & North Africa (IDA & IBRD countries)Middle incomeMoldovaMontenegroMoroccoMozambiqueMyanmarNetherlandsNew CaledoniaNew ZealandNicaraguaNigerNigeriaNorth AmericaNorwayOECD membersOmanOther small statesPacific island small statesPakistanPanamaPapua New GuineaParaguayPeruPhilippinesPolandPortugalPost-demographic dividendPre-demographic dividendQatarRomaniaRussian FederationRwandaSaudi ArabiaSenegalSerbiaSeychellesSierra LeoneSingaporeSlovak RepublicSloveniaSmall statesSomaliaSouth AfricaSouth AsiaSouth Asia (IDA & IBRD)SpainSri LankaSt. LuciaSt. Vincent and the GrenadinesSub-Saharan Africa Sub-Saharan Africa (excluding high income)Sub-Saharan Africa (IDA & IBRD countries)SudanSurinameSwedenSwitzerlandSyrian Arab RepublicTanzaniaThailandTogoTrinidad and TobagoTunisiaTurkeyUgandaUkraineUnited Arab EmiratesUnited KingdomUnited StatesUpper middle incomeUruguayVenezuela, RBVietnamWorldYemen, Rep.ZambiaZimbabwe Timeline:
This timeline shows a graph from 1961 to 2015 of Egypt, Arab Rep.. No data until 1960. Number of actual observations by date: 55.
Source name:
World Development Indicators
Source organization:
World Bank staff estimates based data from International Monetary Fund's Direction of Trade database.
Categories, topics:
Private Sector, Trade
Last updated:
apr 23, 2017
Indicators value changes by year
At the date of observation
Value
Absolute change
Change from previous value
jan 1, 1961
1.596
+1.596
0.0%
jan 1, 1962
1.387
-0.21
-13.12%
jan 1, 1963
1.107
-0.28
-20.21%
jan 1, 1964
1.539
+0.432
39.06%
jan 1, 1965
0.797
-0.741
-48.18%
jan 1, 1966
0.879
+0.081
10.18%
jan 1, 1967
1.43
+0.551
62.76%
jan 1, 1968
2.136
+0.706
49.35%
jan 1, 1969
0.974
-1.162
-54.42%
jan 1, 1970
2.864
+1.89
194.15%
jan 1, 1971
3.163
+0.3
10.47%
jan 1, 1972
2.372
-0.792
-25.02%
jan 1, 1973
2.881
+0.509
21.48%
jan 1, 1974
2.411
-0.47
-16.32%
jan 1, 1975
1.499
-0.912
-37.83%
jan 1, 1976
1.799
+0.3
20.03%
jan 1, 1977
1.463
-0.336
-18.69%
jan 1, 1978
1.291
-0.172
-11.73%
jan 1, 1979
0.864
-0.427
-33.07%
jan 1, 1980
0.829
-0.035
-4.05%
jan 1, 1981
0.726
-0.103
-12.47%
jan 1, 1982
0.731
+0.005
0.72%
jan 1, 1983
1.026
+0.295
40.37%
jan 1, 1984
0.987
-0.04
-3.87%
jan 1, 1985
1.66
+0.673
68.26%
jan 1, 1986
0.402
-1.258
-75.81%
jan 1, 1987
1.477
+1.075
267.72%
jan 1, 1988
0.654
-0.823
-55.72%
jan 1, 1989
1.194
+0.54
82.63%
jan 1, 1990
1.463
+0.268
22.45%
jan 1, 1991
1.115
-0.348
-23.79%
jan 1, 1992
1.355
+0.24
21.56%
jan 1, 1993
1.273
-0.082
-6.04%
jan 1, 1994
1.055
-0.218
-17.1%
jan 1, 1995
1.031
-0.024
-2.32%
jan 1, 1996
1.398
+0.368
35.65%
jan 1, 1997
1.345
-0.053
-3.79%
jan 1, 1998
1.267
-0.078
-5.82%
jan 1, 1999
0.949
-0.318
-25.13%
jan 1, 2000
1.139
+0.19
20.02%
jan 1, 2001
0.963
-0.176
-15.42%
jan 1, 2002
2.102
+1.139
118.25%
jan 1, 2003
2.578
+0.476
22.64%
jan 1, 2004
2.158
-0.42
-16.3%
jan 1, 2005
1.459
-0.699
-32.4%
jan 1, 2006
1.203
-0.256
-17.52%
jan 1, 2007
0.806
-0.397
-33.0%
jan 1, 2008
0.926
+0.12
14.87%
jan 1, 2009
1.92
+0.994
107.37%
jan 1, 2010
1.448
-0.472
-24.57%
jan 1, 2011
1.481
+0.032
2.23%
jan 1, 2012
1.547
+0.066
4.49%
jan 1, 2013
1.282
-0.265
-17.12%
jan 1, 2014
1.147
-0.135
-10.54%
jan 1, 2015
1.097
-0.05
-4.33%
Ranking of countries by current statistics by years


Comments: