29
/
en
AIzaSyAYiBZKx7MnpbEhh9jyipgxe19OcubqV5w
April 1, 2024
30075
Euro area
EMU
false
2
1
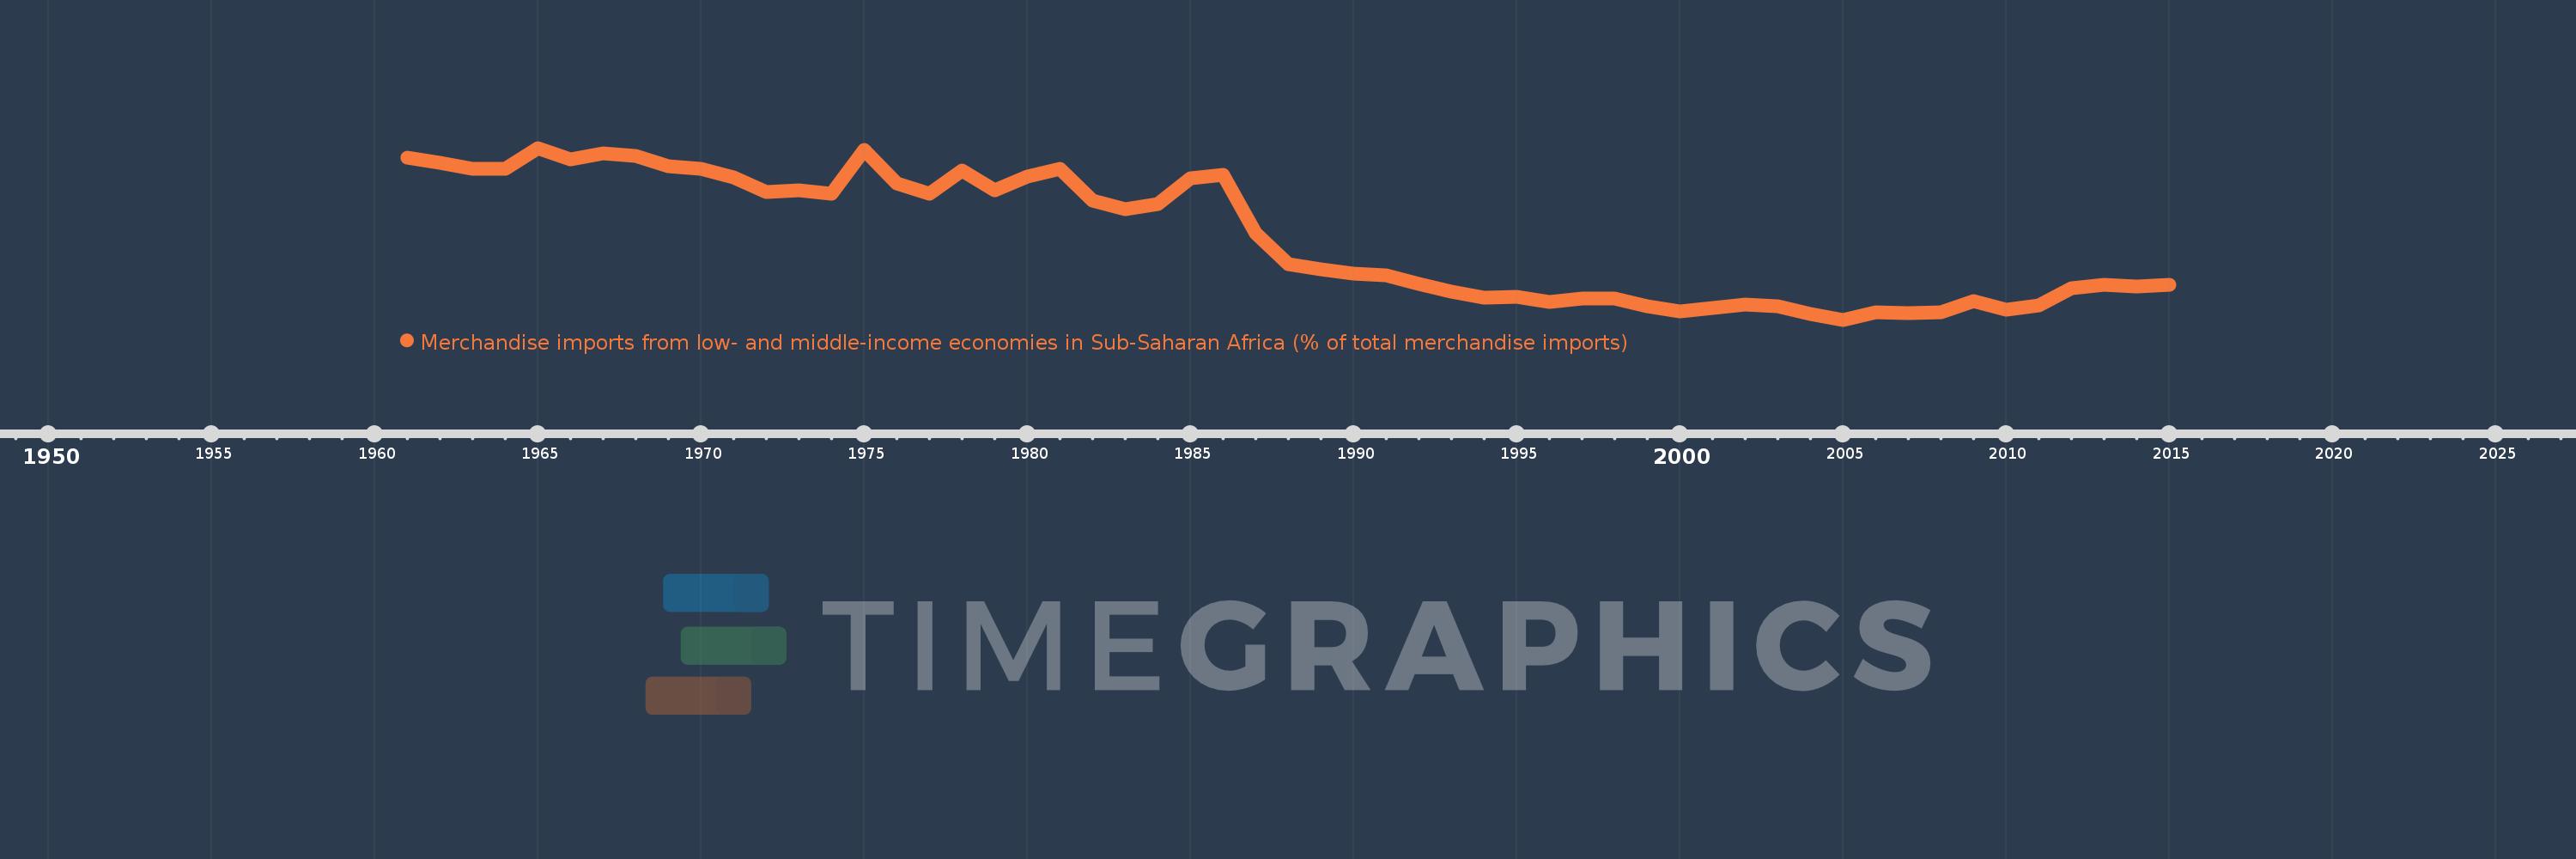
Merchandise imports from low- and middle-income economies in Sub-Saharan Africa (% of total merchandise imports)
2015,2014,2013,2012,2011,2010,2009,2008,2007,2006,2005,2004,2003,2002,2001,2000,1999,1998,1997,1996,1995,1994,1993,1992,1991,1990,1989,1988,1987,1986,1985,1984,1983,1982,1981,1980,1979,1978,1977,1976,1975,1974,1973,1972,1971,1970,1969,1968,1967,1966,1965,1964,1963,1962,1961
This statistics in other country:
AlbaniaAlgeriaAngolaArab WorldArgentinaArmeniaArubaAustraliaAustriaAzerbaijanBahamas, TheBahrainBangladeshBarbadosBelarusBelgiumBelizeBeninBermudaBoliviaBrazilBrunei DarussalamBulgariaBurkina FasoBurundiCabo VerdeCambodiaCameroonCanadaCaribbean small statesCentral African RepublicCentral Europe and the BalticsChadChileChinaColombiaCongo, Dem. Rep.Congo, Rep.Costa RicaCote d'IvoireCroatiaCubaCyprusCzech RepublicDenmarkDjiboutiDominicaDominican RepublicEarly-demographic dividendEast Asia & PacificEast Asia & Pacific (excluding high income)East Asia & Pacific (IDA & IBRD countries)EcuadorEgypt, Arab Rep.El SalvadorEstoniaEthiopiaEuro areaEurope & Central AsiaEurope & Central Asia (excluding high income)Europe & Central Asia (IDA & IBRD countries)European UnionFijiFinlandFragile and conflict affected situationsFranceGabonGambia, TheGeorgiaGermanyGhanaGreeceGreenlandGrenadaGuatemalaGuineaGuinea-BissauGuyanaHaitiHeavily indebted poor countries (HIPC)High incomeHondurasHong Kong SAR, ChinaHungaryIBRD onlyIcelandIDA & IBRD totalIDA blendIDA onlyIDA totalIndiaIndonesiaIran, Islamic Rep.IraqIrelandIsraelItalyJamaicaJapanJordanKazakhstanKenyaKorea, Dem. People’s Rep.Korea, Rep.KuwaitLao PDRLate-demographic dividendLatin America & Caribbean Latin America & Caribbean (excluding high income)Latin America & the Caribbean (IDA & IBRD countries)LatviaLeast developed countries: UN classificationLebanonLiberiaLibyaLithuaniaLow & middle incomeLow incomeLower middle incomeLuxembourgMacao SAR, ChinaMacedonia, FYRMadagascarMalawiMalaysiaMaliMaltaMauritaniaMauritiusMexicoMiddle East & North AfricaMiddle East & North Africa (excluding high income)Middle East & North Africa (IDA & IBRD countries)Middle incomeMoldovaMontenegroMoroccoMozambiqueMyanmarNetherlandsNew CaledoniaNew ZealandNicaraguaNigerNigeriaNorth AmericaNorwayOECD membersOmanOther small statesPacific island small statesPakistanPanamaPapua New GuineaParaguayPeruPhilippinesPolandPortugalPost-demographic dividendPre-demographic dividendQatarRomaniaRussian FederationRwandaSaudi ArabiaSenegalSerbiaSeychellesSierra LeoneSingaporeSlovak RepublicSloveniaSmall statesSomaliaSouth AfricaSouth AsiaSouth Asia (IDA & IBRD)SpainSri LankaSt. LuciaSt. Vincent and the GrenadinesSub-Saharan Africa Sub-Saharan Africa (excluding high income)Sub-Saharan Africa (IDA & IBRD countries)SudanSurinameSwedenSwitzerlandSyrian Arab RepublicTanzaniaThailandTogoTrinidad and TobagoTunisiaTurkeyUgandaUkraineUnited Arab EmiratesUnited KingdomUnited StatesUpper middle incomeUruguayVenezuela, RBVietnamWorldYemen, Rep.ZambiaZimbabwe Timeline:
This timeline shows a graph from 1961 to 2015 of Euro area. No data until 1960. Number of actual observations by date: 55.
Source name:
World Development Indicators
Source organization:
World Bank staff estimates based data from International Monetary Fund's Direction of Trade database.
Categories, topics:
Private Sector, Trade
Last updated:
apr 23, 2017
Indicators value changes by year
At the date of observation
Value
Absolute change
Change from previous value
jan 1, 1961
4.517
+4.517
0.0%
jan 1, 1962
4.425
-0.092
-2.04%
jan 1, 1963
4.307
-0.118
-2.66%
jan 1, 1964
4.301
-0.006
-0.15%
jan 1, 1965
4.717
+0.416
9.67%
jan 1, 1966
4.484
-0.233
-4.94%
jan 1, 1967
4.616
+0.132
2.93%
jan 1, 1968
4.565
-0.051
-1.1%
jan 1, 1969
4.35
-0.214
-4.69%
jan 1, 1970
4.306
-0.045
-1.03%
jan 1, 1971
4.132
-0.174
-4.05%
jan 1, 1972
3.828
-0.303
-7.34%
jan 1, 1973
3.875
+0.047
1.22%
jan 1, 1974
3.795
-0.08
-2.05%
jan 1, 1975
4.685
+0.89
23.45%
jan 1, 1976
4.005
-0.68
-14.52%
jan 1, 1977
3.796
-0.209
-5.21%
jan 1, 1978
4.258
+0.462
12.17%
jan 1, 1979
3.87
-0.388
-9.11%
jan 1, 1980
4.145
+0.275
7.09%
jan 1, 1981
4.299
+0.154
3.71%
jan 1, 1982
3.67
-0.628
-14.62%
jan 1, 1983
3.482
-0.188
-5.12%
jan 1, 1984
3.588
+0.105
3.03%
jan 1, 1985
4.107
+0.519
14.46%
jan 1, 1986
4.186
+0.079
1.93%
jan 1, 1987
3.0
-1.186
-28.32%
jan 1, 1988
2.389
-0.611
-20.38%
jan 1, 1989
2.282
-0.107
-4.46%
jan 1, 1990
2.207
-0.076
-3.31%
jan 1, 1991
2.169
-0.038
-1.72%
jan 1, 1992
1.994
-0.175
-8.06%
jan 1, 1993
1.838
-0.156
-7.82%
jan 1, 1994
1.72
-0.117
-6.39%
jan 1, 1995
1.729
+0.009
0.51%
jan 1, 1996
1.637
-0.092
-5.3%
jan 1, 1997
1.697
+0.059
3.61%
jan 1, 1998
1.701
+0.005
0.28%
jan 1, 1999
1.544
-0.157
-9.22%
jan 1, 2000
1.442
-0.103
-6.65%
jan 1, 2001
1.52
+0.078
5.4%
jan 1, 2002
1.585
+0.066
4.33%
jan 1, 2003
1.542
-0.043
-2.72%
jan 1, 2004
1.395
-0.147
-9.55%
jan 1, 2005
1.276
-0.119
-8.55%
jan 1, 2006
1.431
+0.155
12.18%
jan 1, 2007
1.409
-0.023
-1.57%
jan 1, 2008
1.432
+0.023
1.64%
jan 1, 2009
1.647
+0.215
15.04%
jan 1, 2010
1.484
-0.163
-9.9%
jan 1, 2011
1.566
+0.082
5.51%
jan 1, 2012
1.905
+0.339
21.65%
jan 1, 2013
1.972
+0.067
3.54%
jan 1, 2014
1.945
-0.027
-1.38%
jan 1, 2015
1.981
+0.036
1.83%
Ranking of countries by current statistics by years


Comments: