29
/
en
AIzaSyAYiBZKx7MnpbEhh9jyipgxe19OcubqV5w
April 1, 2024
120119
Djibouti
DJI
true
2
1
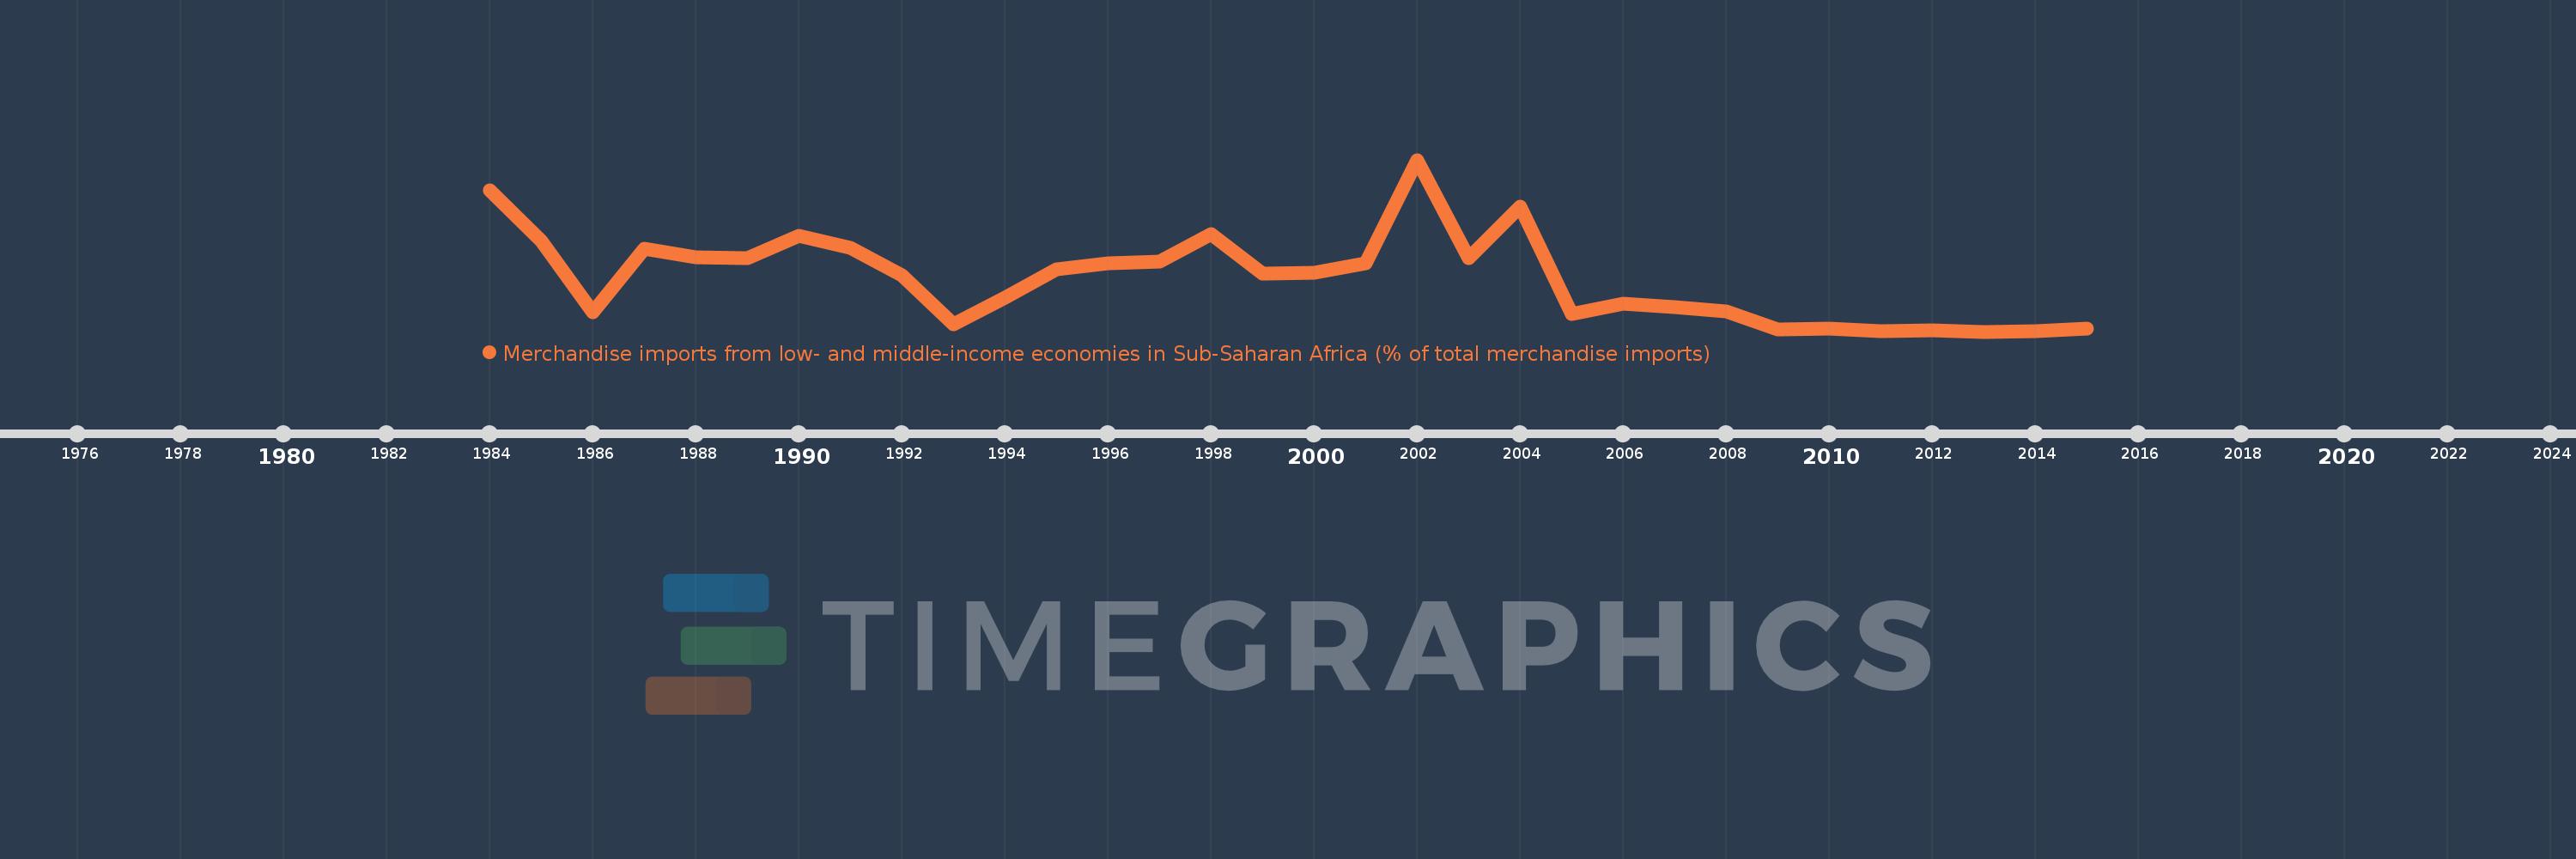
Merchandise imports from low- and middle-income economies in Sub-Saharan Africa (% of total merchandise imports)
2015,2014,2013,2012,2011,2010,2009,2008,2007,2006,2005,2004,2003,2002,2001,2000,1999,1998,1997,1996,1995,1994,1993,1992,1991,1990,1989,1988,1987,1986,1985,1984
This statistics in other country:
AlbaniaAlgeriaAngolaArab WorldArgentinaArmeniaArubaAustraliaAustriaAzerbaijanBahamas, TheBahrainBangladeshBarbadosBelarusBelgiumBelizeBeninBermudaBoliviaBrazilBrunei DarussalamBulgariaBurkina FasoBurundiCabo VerdeCambodiaCameroonCanadaCaribbean small statesCentral African RepublicCentral Europe and the BalticsChadChileChinaColombiaCongo, Dem. Rep.Congo, Rep.Costa RicaCote d'IvoireCroatiaCubaCyprusCzech RepublicDenmarkDjiboutiDominicaDominican RepublicEarly-demographic dividendEast Asia & PacificEast Asia & Pacific (excluding high income)East Asia & Pacific (IDA & IBRD countries)EcuadorEgypt, Arab Rep.El SalvadorEstoniaEthiopiaEuro areaEurope & Central AsiaEurope & Central Asia (excluding high income)Europe & Central Asia (IDA & IBRD countries)European UnionFijiFinlandFragile and conflict affected situationsFranceGabonGambia, TheGeorgiaGermanyGhanaGreeceGreenlandGrenadaGuatemalaGuineaGuinea-BissauGuyanaHaitiHeavily indebted poor countries (HIPC)High incomeHondurasHong Kong SAR, ChinaHungaryIBRD onlyIcelandIDA & IBRD totalIDA blendIDA onlyIDA totalIndiaIndonesiaIran, Islamic Rep.IraqIrelandIsraelItalyJamaicaJapanJordanKazakhstanKenyaKorea, Dem. People’s Rep.Korea, Rep.KuwaitLao PDRLate-demographic dividendLatin America & Caribbean Latin America & Caribbean (excluding high income)Latin America & the Caribbean (IDA & IBRD countries)LatviaLeast developed countries: UN classificationLebanonLiberiaLibyaLithuaniaLow & middle incomeLow incomeLower middle incomeLuxembourgMacao SAR, ChinaMacedonia, FYRMadagascarMalawiMalaysiaMaliMaltaMauritaniaMauritiusMexicoMiddle East & North AfricaMiddle East & North Africa (excluding high income)Middle East & North Africa (IDA & IBRD countries)Middle incomeMoldovaMontenegroMoroccoMozambiqueMyanmarNetherlandsNew CaledoniaNew ZealandNicaraguaNigerNigeriaNorth AmericaNorwayOECD membersOmanOther small statesPacific island small statesPakistanPanamaPapua New GuineaParaguayPeruPhilippinesPolandPortugalPost-demographic dividendPre-demographic dividendQatarRomaniaRussian FederationRwandaSaudi ArabiaSenegalSerbiaSeychellesSierra LeoneSingaporeSlovak RepublicSloveniaSmall statesSomaliaSouth AfricaSouth AsiaSouth Asia (IDA & IBRD)SpainSri LankaSt. LuciaSt. Vincent and the GrenadinesSub-Saharan Africa Sub-Saharan Africa (excluding high income)Sub-Saharan Africa (IDA & IBRD countries)SudanSurinameSwedenSwitzerlandSyrian Arab RepublicTanzaniaThailandTogoTrinidad and TobagoTunisiaTurkeyUgandaUkraineUnited Arab EmiratesUnited KingdomUnited StatesUpper middle incomeUruguayVenezuela, RBVietnamWorldYemen, Rep.ZambiaZimbabwe Timeline:
This timeline shows a graph from 1984 to 2015 of Djibouti. No data until 1983. Number of actual observations by date: 32.
Source name:
World Development Indicators
Source organization:
World Bank staff estimates based data from International Monetary Fund's Direction of Trade database.
Categories, topics:
Private Sector, Trade
Last updated:
apr 23, 2017
Indicators value changes by year
Maximum:
21.413
jan 1, 2002
At the date of observation
Value
Absolute change
Change from previous value
jan 1, 1984
18.176
+18.176
0.0%
jan 1, 1985
12.768
-5.408
-29.75%
jan 1, 1986
5.243
-7.525
-58.93%
jan 1, 1987
11.929
+6.685
127.5%
jan 1, 1988
11.023
-0.906
-7.59%
jan 1, 1989
10.917
-0.106
-0.97%
jan 1, 1990
13.339
+2.422
22.19%
jan 1, 1991
12.008
-1.331
-9.98%
jan 1, 1992
9.173
-2.835
-23.61%
jan 1, 1993
3.881
-5.292
-57.69%
jan 1, 1994
6.726
+2.845
73.29%
jan 1, 1995
9.809
+3.083
45.84%
jan 1, 1996
10.429
+0.62
6.32%
jan 1, 1997
10.594
+0.165
1.59%
jan 1, 1998
13.482
+2.888
27.26%
jan 1, 1999
9.279
-4.203
-31.18%
jan 1, 2000
9.425
+0.146
1.57%
jan 1, 2001
10.409
+0.984
10.44%
jan 1, 2002
21.413
+11.004
105.71%
jan 1, 2003
10.917
-10.495
-49.01%
jan 1, 2004
16.45
+5.532
50.68%
jan 1, 2005
5.003
-11.447
-69.59%
jan 1, 2006
6.162
+1.159
23.17%
jan 1, 2007
5.747
-0.415
-6.73%
jan 1, 2008
5.318
-0.43
-7.48%
jan 1, 2009
3.361
-1.957
-36.79%
jan 1, 2010
3.513
+0.152
4.51%
jan 1, 2011
3.239
-0.274
-7.79%
jan 1, 2012
3.248
+0.009
0.28%
jan 1, 2013
3.15
-0.098
-3.02%
jan 1, 2014
3.174
+0.023
0.74%
jan 1, 2015
3.431
+0.258
8.12%
Ranking of countries by current statistics by years


Comments: