29
/
en
AIzaSyAYiBZKx7MnpbEhh9jyipgxe19OcubqV5w
April 1, 2024
85273
Bermuda
BMU
true
2
1
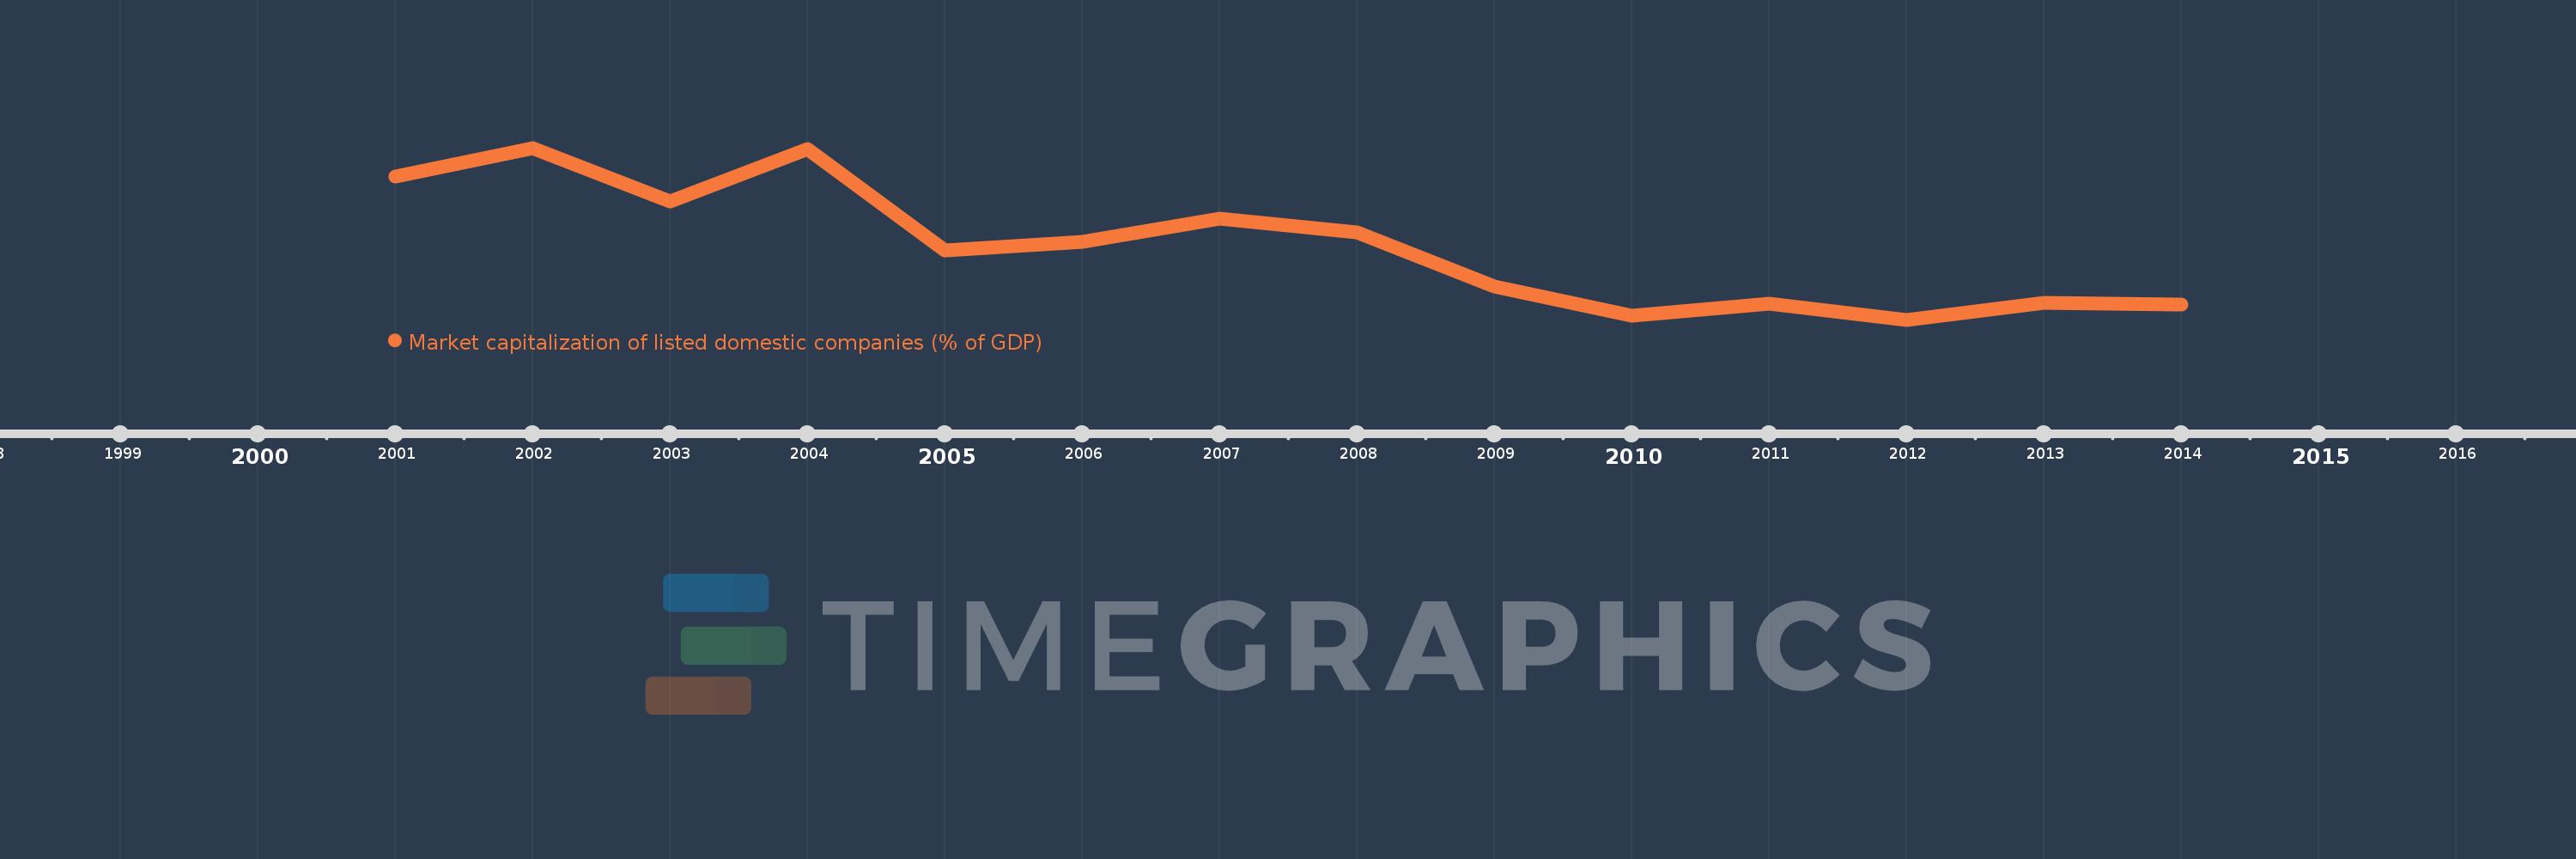
Market capitalization of listed domestic companies (% of GDP)
2014,2013,2012,2011,2010,2009,2008,2007,2006,2005,2004,2003,2002,2001
This statistics in other country:
Timeline:
This timeline shows a graph from 2001 to 2014 of Bermuda. No data until 2000. Number of actual observations by date: 14.
Source name:
World Development Indicators
Source organization:
World Federation of Exchanges database.
Categories, topics:
Financial Sector
Last updated:
apr 23, 2017
Indicators value changes by year
Minimum:
22.201
jan 1, 2012
Maximum:
69.502
jan 1, 2002
At the date of observation
Value
Absolute change
Change from previous value
jan 1, 2001
61.663
+61.663
0.0%
jan 1, 2002
69.502
+7.839
12.71%
jan 1, 2003
54.683
-14.819
-21.32%
jan 1, 2004
69.287
+14.603
26.71%
jan 1, 2005
41.239
-28.048
-40.48%
jan 1, 2006
43.647
+2.408
5.84%
jan 1, 2007
49.933
+6.286
14.4%
jan 1, 2008
46.329
-3.604
-7.22%
jan 1, 2009
31.299
-15.03
-32.44%
jan 1, 2010
23.426
-7.873
-25.15%
jan 1, 2011
26.721
+3.295
14.07%
jan 1, 2012
22.201
-4.52
-16.91%
jan 1, 2013
26.851
+4.65
20.94%
jan 1, 2014
26.32
-0.531
-1.98%
Ranking of countries by current statistics by years


Comments: