29
/
en
AIzaSyAYiBZKx7MnpbEhh9jyipgxe19OcubqV5w
April 1, 2024
241837
Slovak Republic
SVK
true
2
1
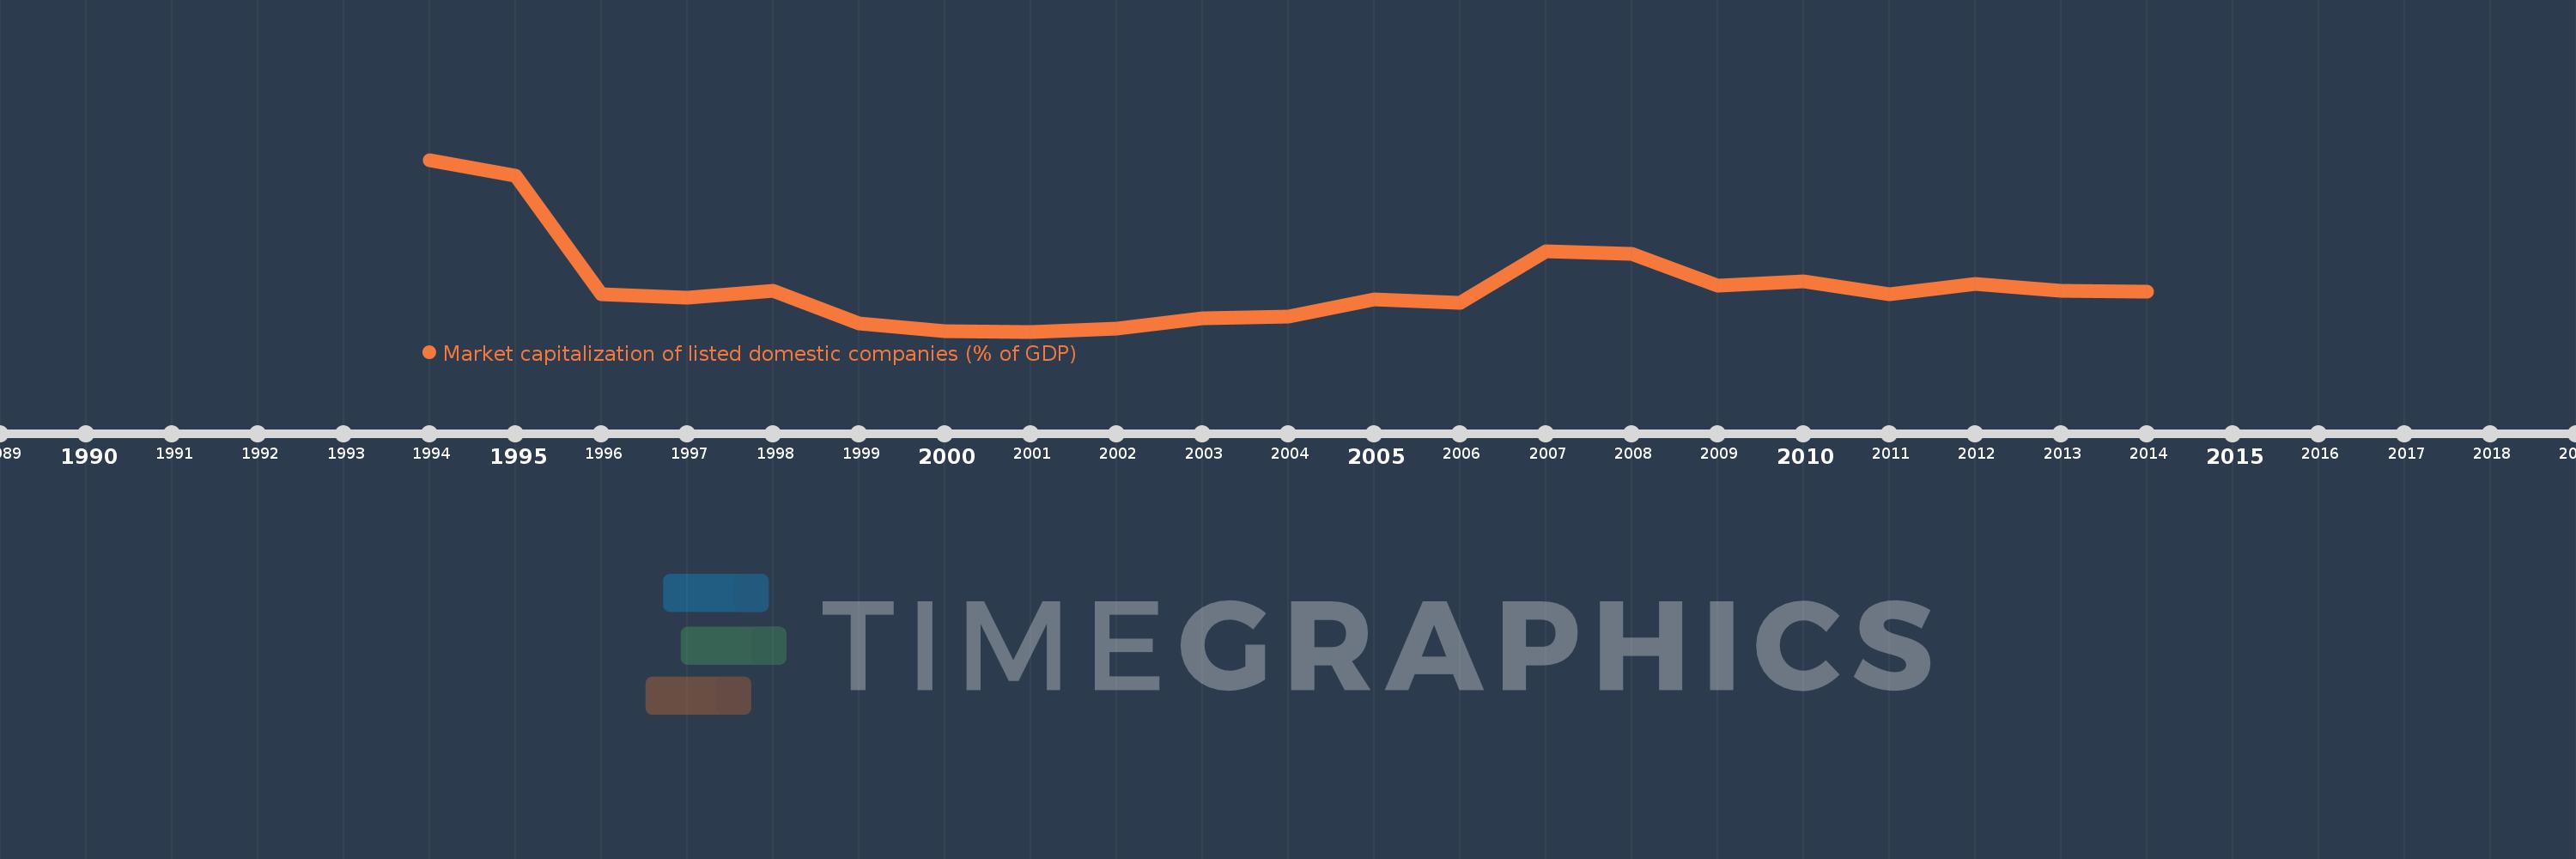
Market capitalization of listed domestic companies (% of GDP)
2014,2013,2012,2011,2010,2009,2008,2007,2006,2005,2004,2003,2002,2001,2000,1999,1998,1997,1996,1995,1994
This statistics in other country:
Timeline:
This timeline shows a graph from 1994 to 2014 of Slovak Republic. No data until 1993. Number of actual observations by date: 21.
Source name:
World Development Indicators
Source organization:
World Federation of Exchanges database.
Categories, topics:
Financial Sector
Last updated:
apr 23, 2017
Indicators value changes by year
Maximum:
15.961
jan 1, 1994
At the date of observation
Value
Absolute change
Change from previous value
jan 1, 1994
15.961
+15.961
0.0%
jan 1, 1995
14.621
-1.34
-8.4%
jan 1, 1996
4.671
-9.95
-68.06%
jan 1, 1997
4.348
-0.322
-6.9%
jan 1, 1998
4.916
+0.568
13.05%
jan 1, 1999
2.181
-2.735
-55.64%
jan 1, 2000
1.512
-0.668
-30.65%
jan 1, 2001
1.498
-0.014
-0.94%
jan 1, 2002
1.77
+0.272
18.16%
jan 1, 2003
2.641
+0.871
49.22%
jan 1, 2004
2.771
+0.129
4.9%
jan 1, 2005
4.209
+1.438
51.89%
jan 1, 2006
3.92
-0.288
-6.85%
jan 1, 2007
8.26
+4.34
110.7%
jan 1, 2008
8.008
-0.253
-3.06%
jan 1, 2009
5.364
-2.644
-33.02%
jan 1, 2010
5.725
+0.361
6.73%
jan 1, 2011
4.655
-1.069
-18.68%
jan 1, 2012
5.532
+0.876
18.82%
jan 1, 2013
4.936
-0.596
-10.78%
jan 1, 2014
4.876
-0.06
-1.22%
Ranking of countries by current statistics by years


Comments: