29
/
en
AIzaSyAYiBZKx7MnpbEhh9jyipgxe19OcubqV5w
April 1, 2024
267091
Trinidad and Tobago
TTO
true
2
1
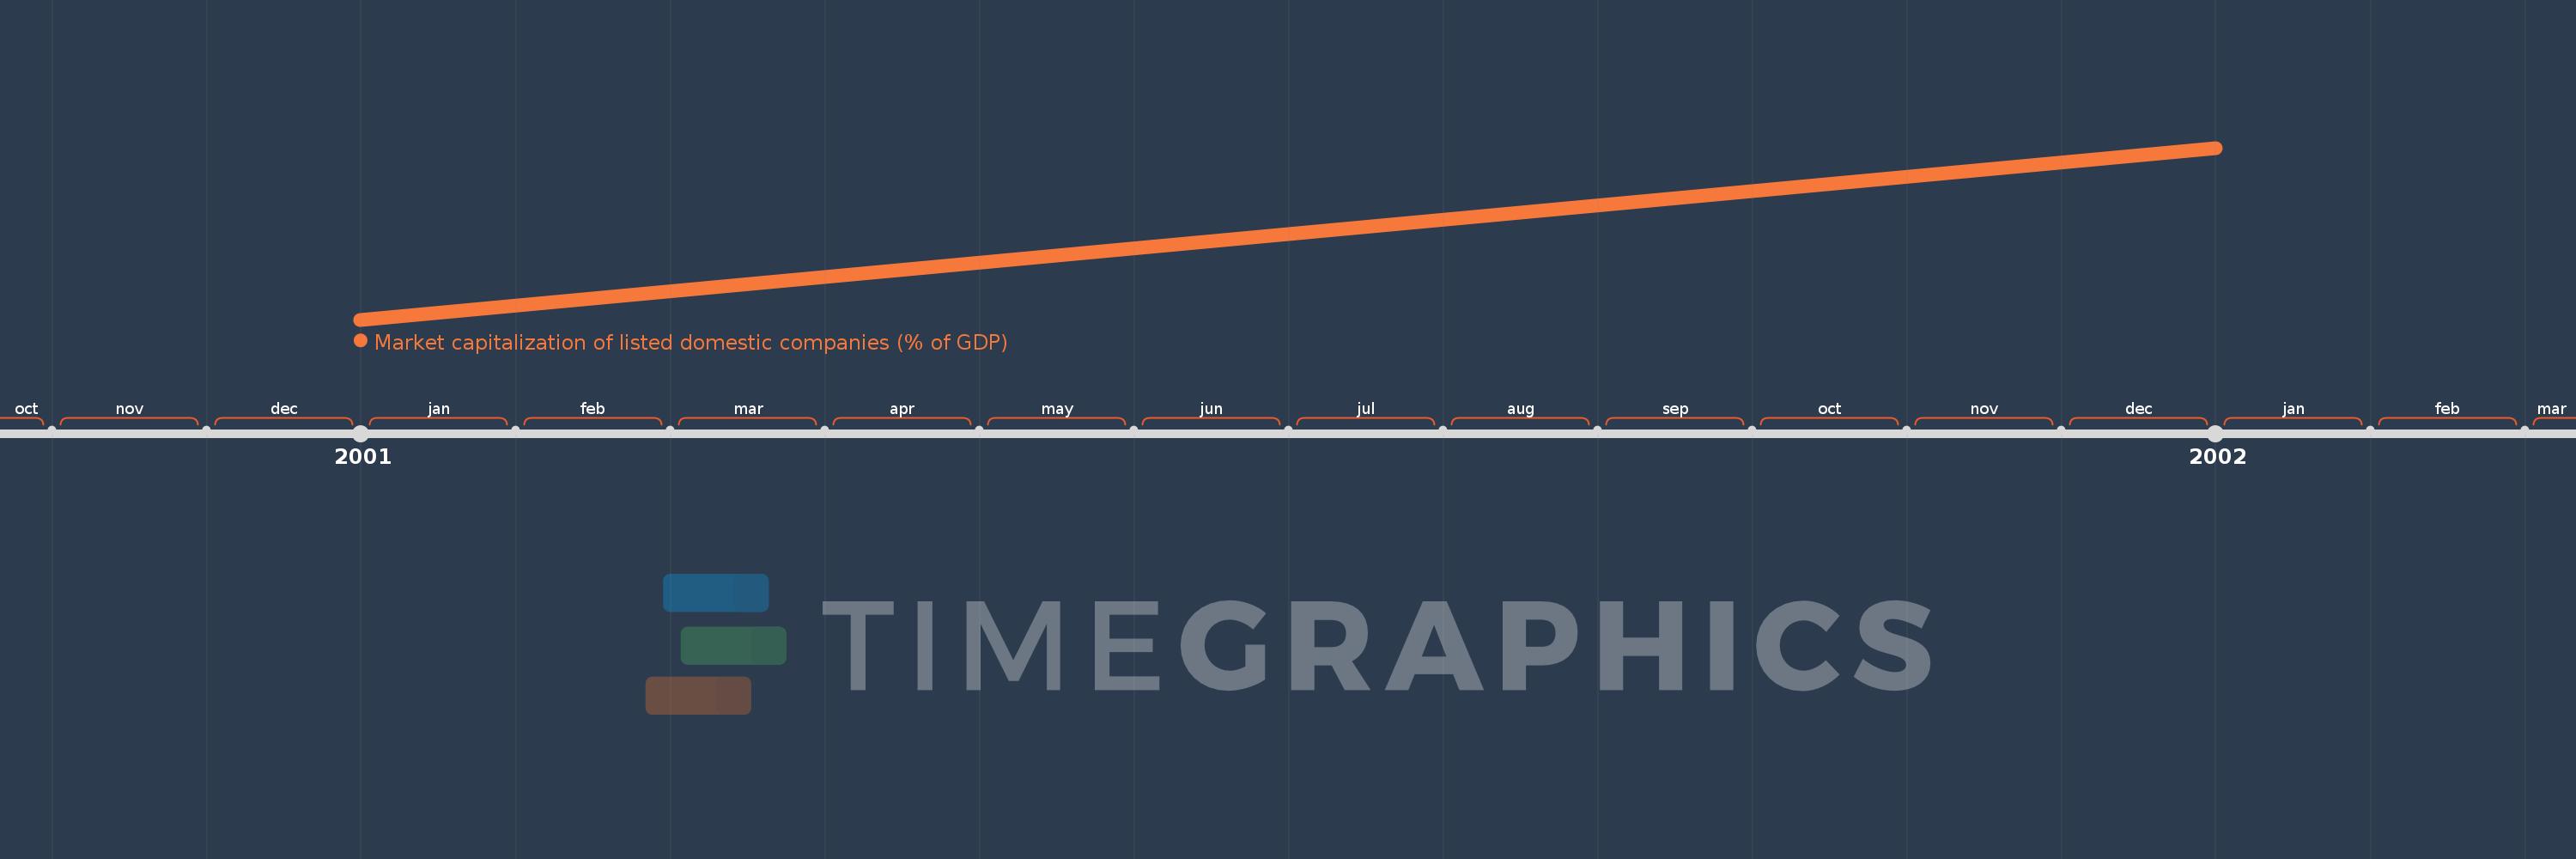
Market capitalization of listed domestic companies (% of GDP)
2002,2001
This statistics in other country:
Timeline:
This timeline shows a graph from 2001 to 2002 of Trinidad and Tobago. No data until 2000. Number of actual observations by date: 2.
Source name:
World Development Indicators
Source organization:
World Federation of Exchanges database.
Categories, topics:
Financial Sector
Last updated:
apr 23, 2017
Indicators value changes by year
Minimum:
41.922
jan 1, 2001
At the date of observation
Value
Absolute change
Change from previous value
jan 1, 2001
41.922
+41.922
0.0%
jan 1, 2002
44.07
+2.147
5.12%
Ranking of countries by current statistics by years


Comments: