29
/
en
AIzaSyAYiBZKx7MnpbEhh9jyipgxe19OcubqV5w
April 1, 2024
45284
Low & middle income
LMY
false
2
1
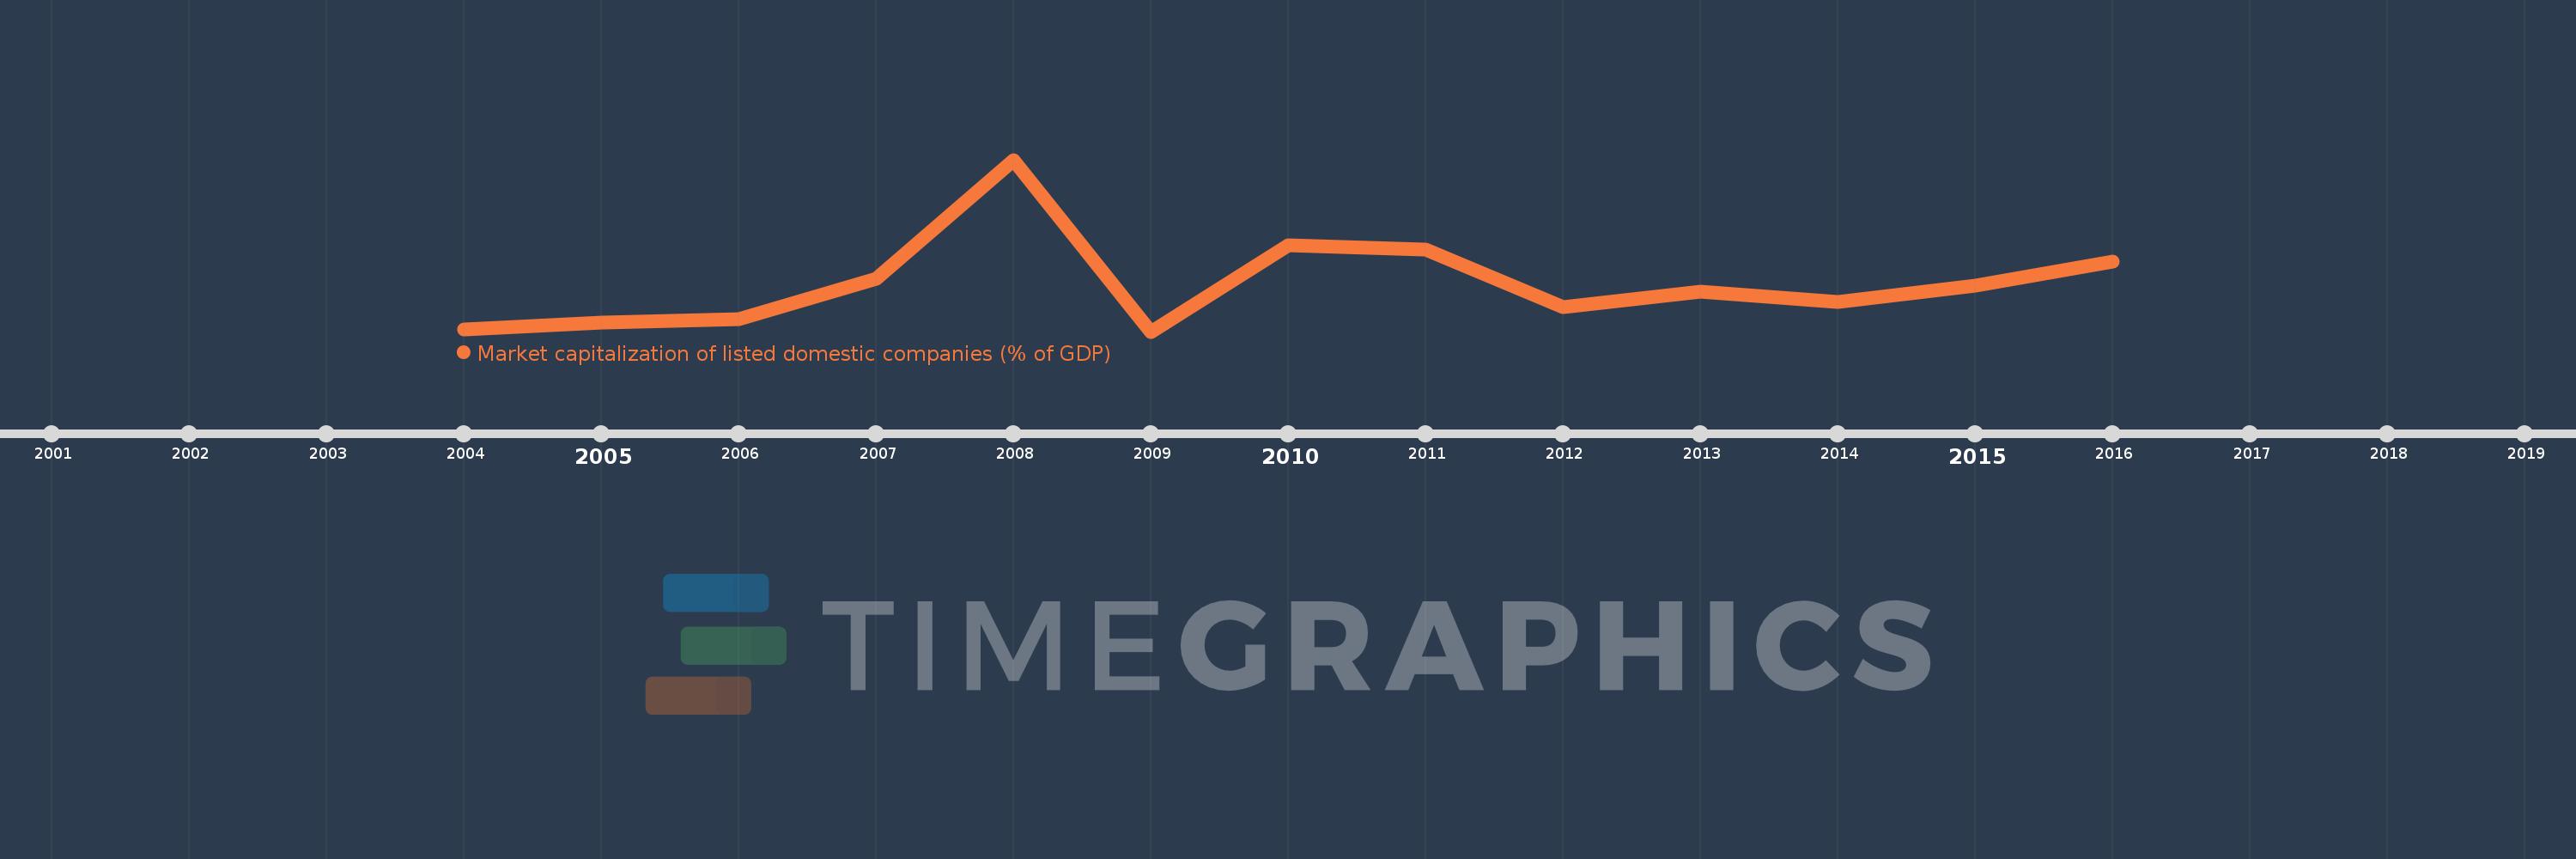
Market capitalization of listed domestic companies (% of GDP)
2016,2015,2014,2013,2012,2011,2010,2009,2008,2007,2006,2005,2004
This statistics in other country:
Timeline:
This timeline shows a graph from 2004 to 2016 of Low & middle income. No data until 2003. Number of actual observations by date: 13.
Source name:
World Development Indicators
Source organization:
World Federation of Exchanges database.
Categories, topics:
Financial Sector
Last updated:
apr 23, 2017
Indicators value changes by year
Minimum:
36.046
jan 1, 2009
Maximum:
95.797
jan 1, 2008
At the date of observation
Value
Absolute change
Change from previous value
jan 1, 2004
36.9
+36.9
0.0%
jan 1, 2005
39.139
+2.239
6.07%
jan 1, 2006
40.344
+1.205
3.08%
jan 1, 2007
54.284
+13.939
34.55%
jan 1, 2008
95.797
+41.514
76.48%
jan 1, 2009
36.046
-59.752
-62.37%
jan 1, 2010
65.942
+29.896
82.94%
jan 1, 2011
64.588
-1.354
-2.05%
jan 1, 2012
44.665
-19.923
-30.85%
jan 1, 2013
49.951
+5.286
11.83%
jan 1, 2014
46.361
-3.59
-7.19%
jan 1, 2015
52.052
+5.691
12.28%
jan 1, 2016
60.385
+8.333
16.01%
Ranking of countries by current statistics by years


Comments: