29
/
en
AIzaSyAYiBZKx7MnpbEhh9jyipgxe19OcubqV5w
April 1, 2024
215512
Oman
OMN
true
2
1
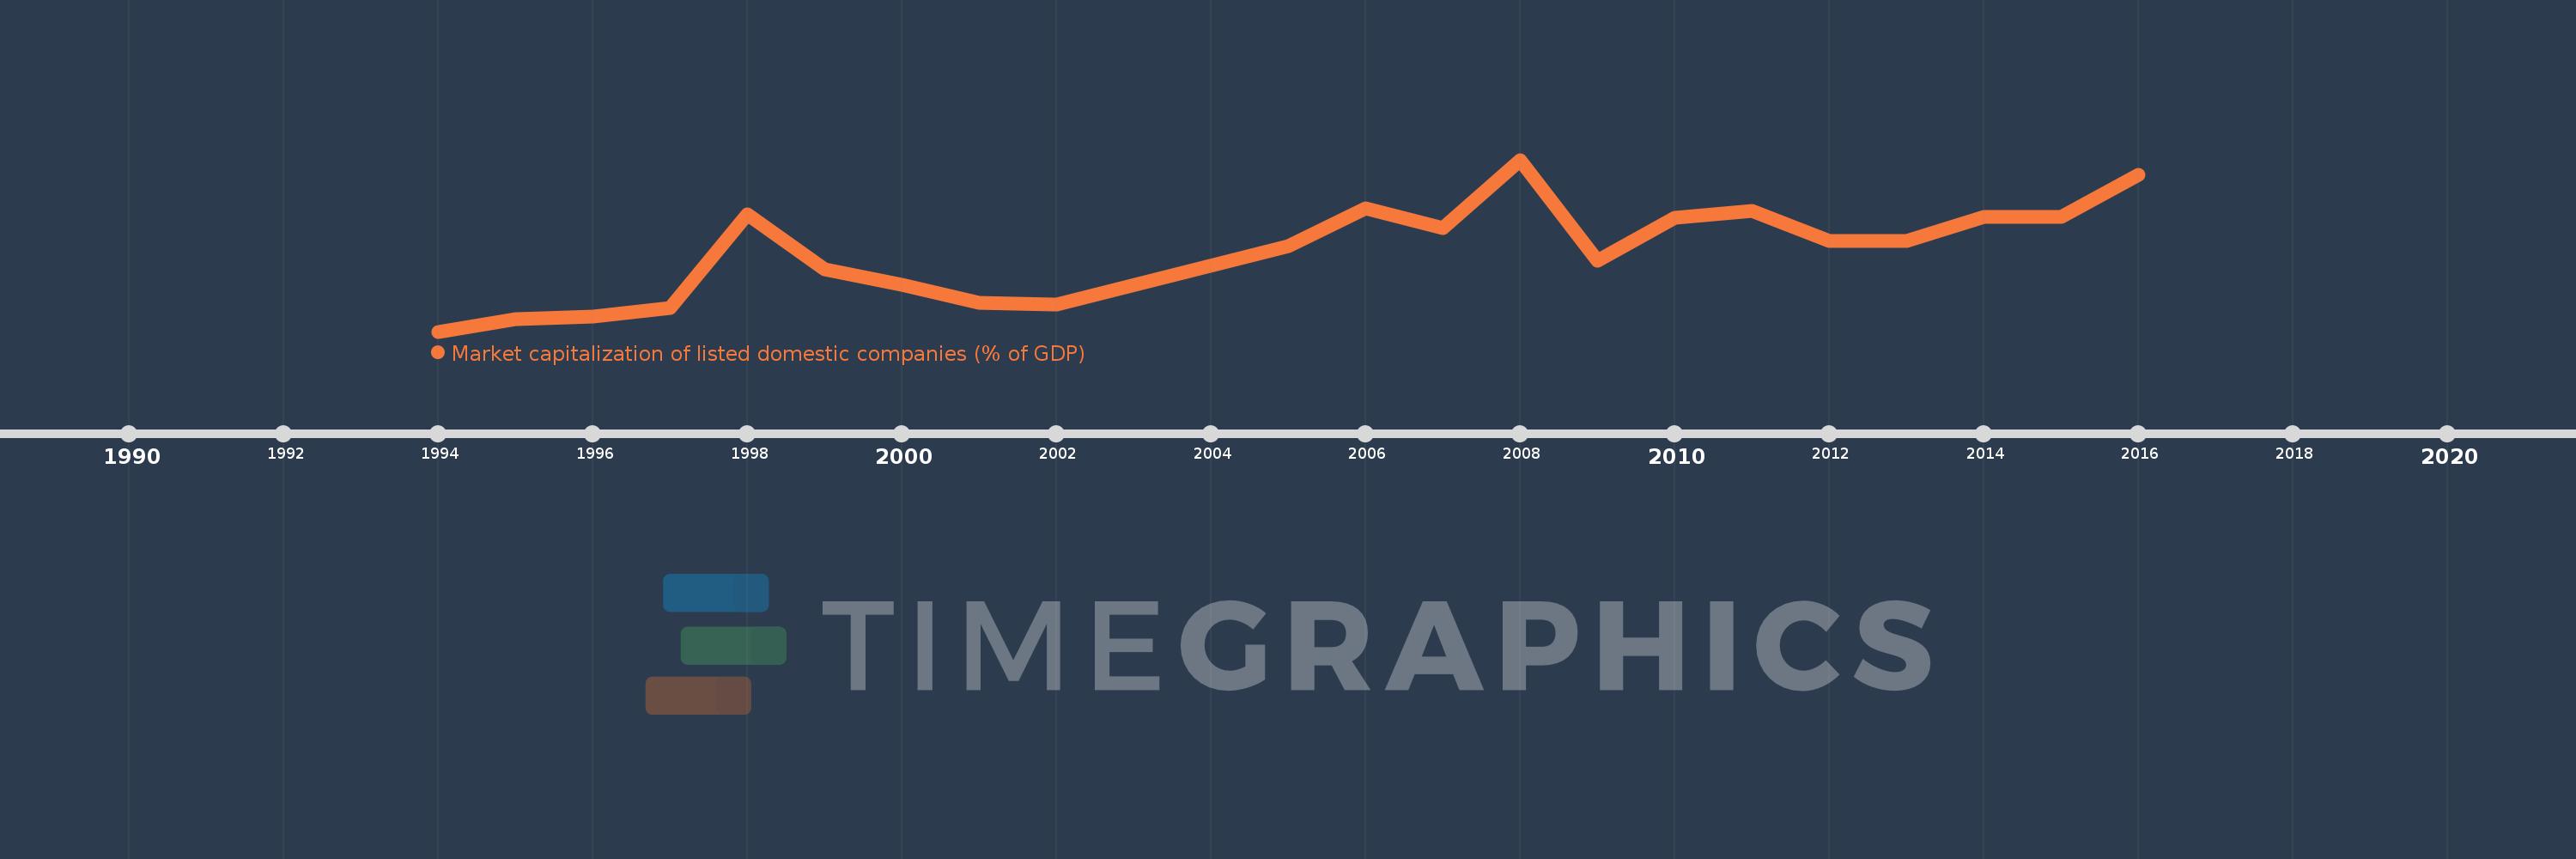
Market capitalization of listed domestic companies (% of GDP)
2016,2015,2014,2013,2012,2011,2010,2009,2008,2007,2006,2005,2002,2001,2000,1999,1998,1997,1996,1995,1994
This statistics in other country:
Timeline:
This timeline shows a graph from 1994 to 2016 of Oman. No data until 1993. Number of actual observations by date: 21.
Source name:
World Development Indicators
Source organization:
World Federation of Exchanges database.
Categories, topics:
Financial Sector
Last updated:
apr 23, 2017
Indicators value changes by year
Minimum:
12.898
jan 1, 1994
At the date of observation
Value
Absolute change
Change from previous value
jan 1, 1994
12.898
+12.898
0.0%
jan 1, 1995
16.511
+3.613
28.02%
jan 1, 1996
17.233
+0.722
4.37%
jan 1, 1997
19.922
+2.689
15.6%
jan 1, 1998
47.328
+27.406
137.57%
jan 1, 1999
31.179
-16.149
-34.12%
jan 1, 2000
26.59
-4.589
-14.72%
jan 1, 2001
21.414
-5.176
-19.47%
jan 1, 2002
20.888
-0.526
-2.46%
jan 1, 2005
38.1
+17.212
82.4%
jan 1, 2006
49.125
+11.025
28.94%
jan 1, 2007
43.272
-5.853
-11.91%
jan 1, 2008
63.4
+20.129
46.52%
jan 1, 2009
33.805
-29.596
-46.68%
jan 1, 2010
46.435
+12.63
37.36%
jan 1, 2011
48.287
+1.852
3.99%
jan 1, 2012
39.541
-8.745
-18.11%
jan 1, 2013
39.499
-0.042
-0.11%
jan 1, 2014
46.576
+7.077
17.92%
jan 1, 2015
46.684
+0.108
0.23%
jan 1, 2016
58.89
+12.206
26.14%
Ranking of countries by current statistics by years


Comments: