29
/
en
AIzaSyAYiBZKx7MnpbEhh9jyipgxe19OcubqV5w
April 1, 2024
78510
Bangladesh
BGD
true
2
1
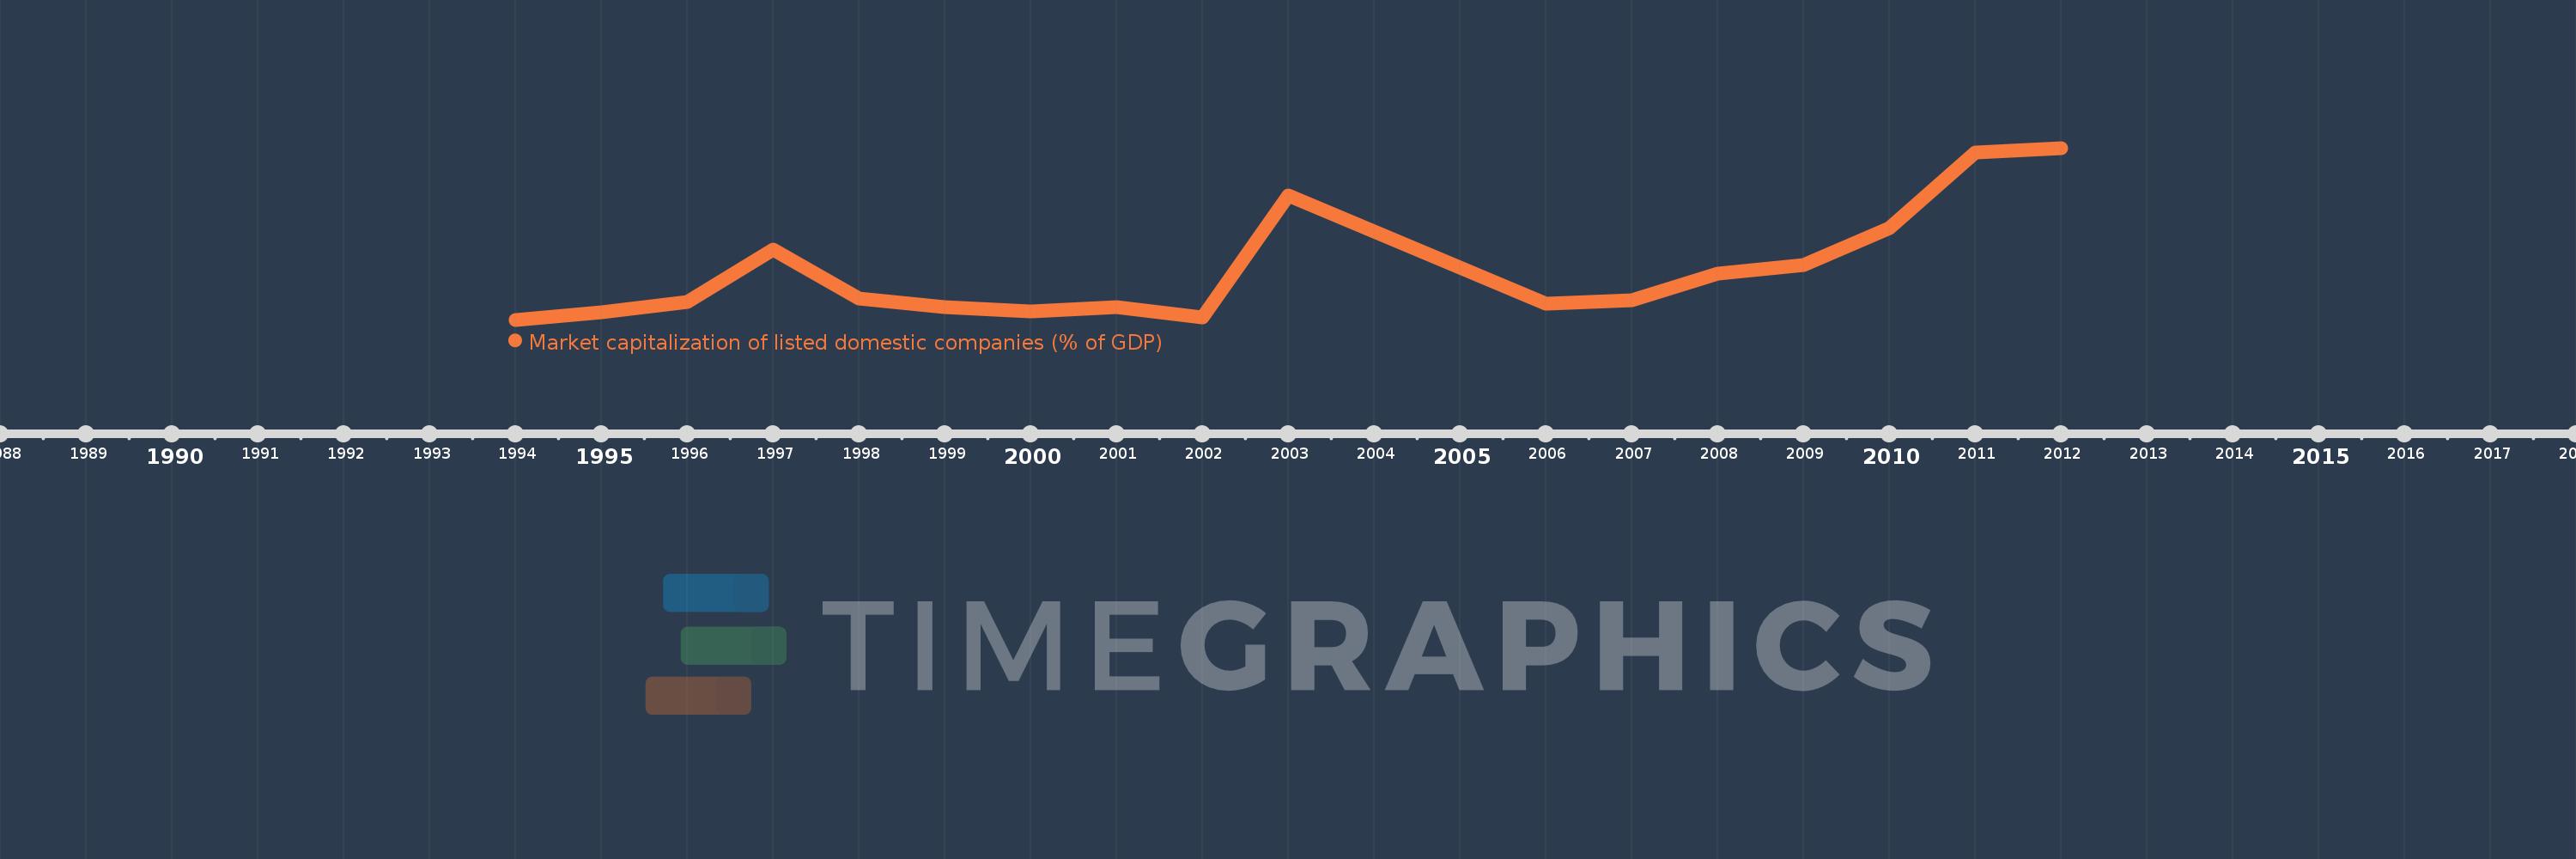
Market capitalization of listed domestic companies (% of GDP)
2012,2011,2010,2009,2008,2007,2006,2003,2002,2001,2000,1999,1998,1997,1996,1995,1994
This statistics in other country:
Timeline:
This timeline shows a graph from 1994 to 2012 of Bangladesh. No data until 1993. Number of actual observations by date: 17.
Source name:
World Development Indicators
Source organization:
World Federation of Exchanges database.
Categories, topics:
Financial Sector
Last updated:
apr 23, 2017
Indicators value changes by year
At the date of observation
Value
Absolute change
Change from previous value
jan 1, 1994
1.399
+1.399
0.0%
jan 1, 1995
3.02
+1.621
115.84%
jan 1, 1996
5.077
+2.057
68.1%
jan 1, 1997
15.895
+10.818
213.08%
jan 1, 1998
5.742
-10.153
-63.87%
jan 1, 1999
4.06
-1.682
-29.29%
jan 1, 2000
3.046
-1.015
-24.99%
jan 1, 2001
4.108
+1.062
34.86%
jan 1, 2002
1.812
-2.296
-55.89%
jan 1, 2003
27.213
+25.401
1.4K%
jan 1, 2006
4.752
-22.461
-82.54%
jan 1, 2007
5.361
+0.61
12.83%
jan 1, 2008
10.969
+5.608
104.61%
jan 1, 2009
12.792
+1.822
16.61%
jan 1, 2010
20.423
+7.631
59.66%
jan 1, 2011
36.101
+15.678
76.77%
jan 1, 2012
37.08
+0.979
2.71%
Ranking of countries by current statistics by years


Comments: