29
/
en
AIzaSyAYiBZKx7MnpbEhh9jyipgxe19OcubqV5w
April 1, 2024
139509
Germany
DEU
true
2
1
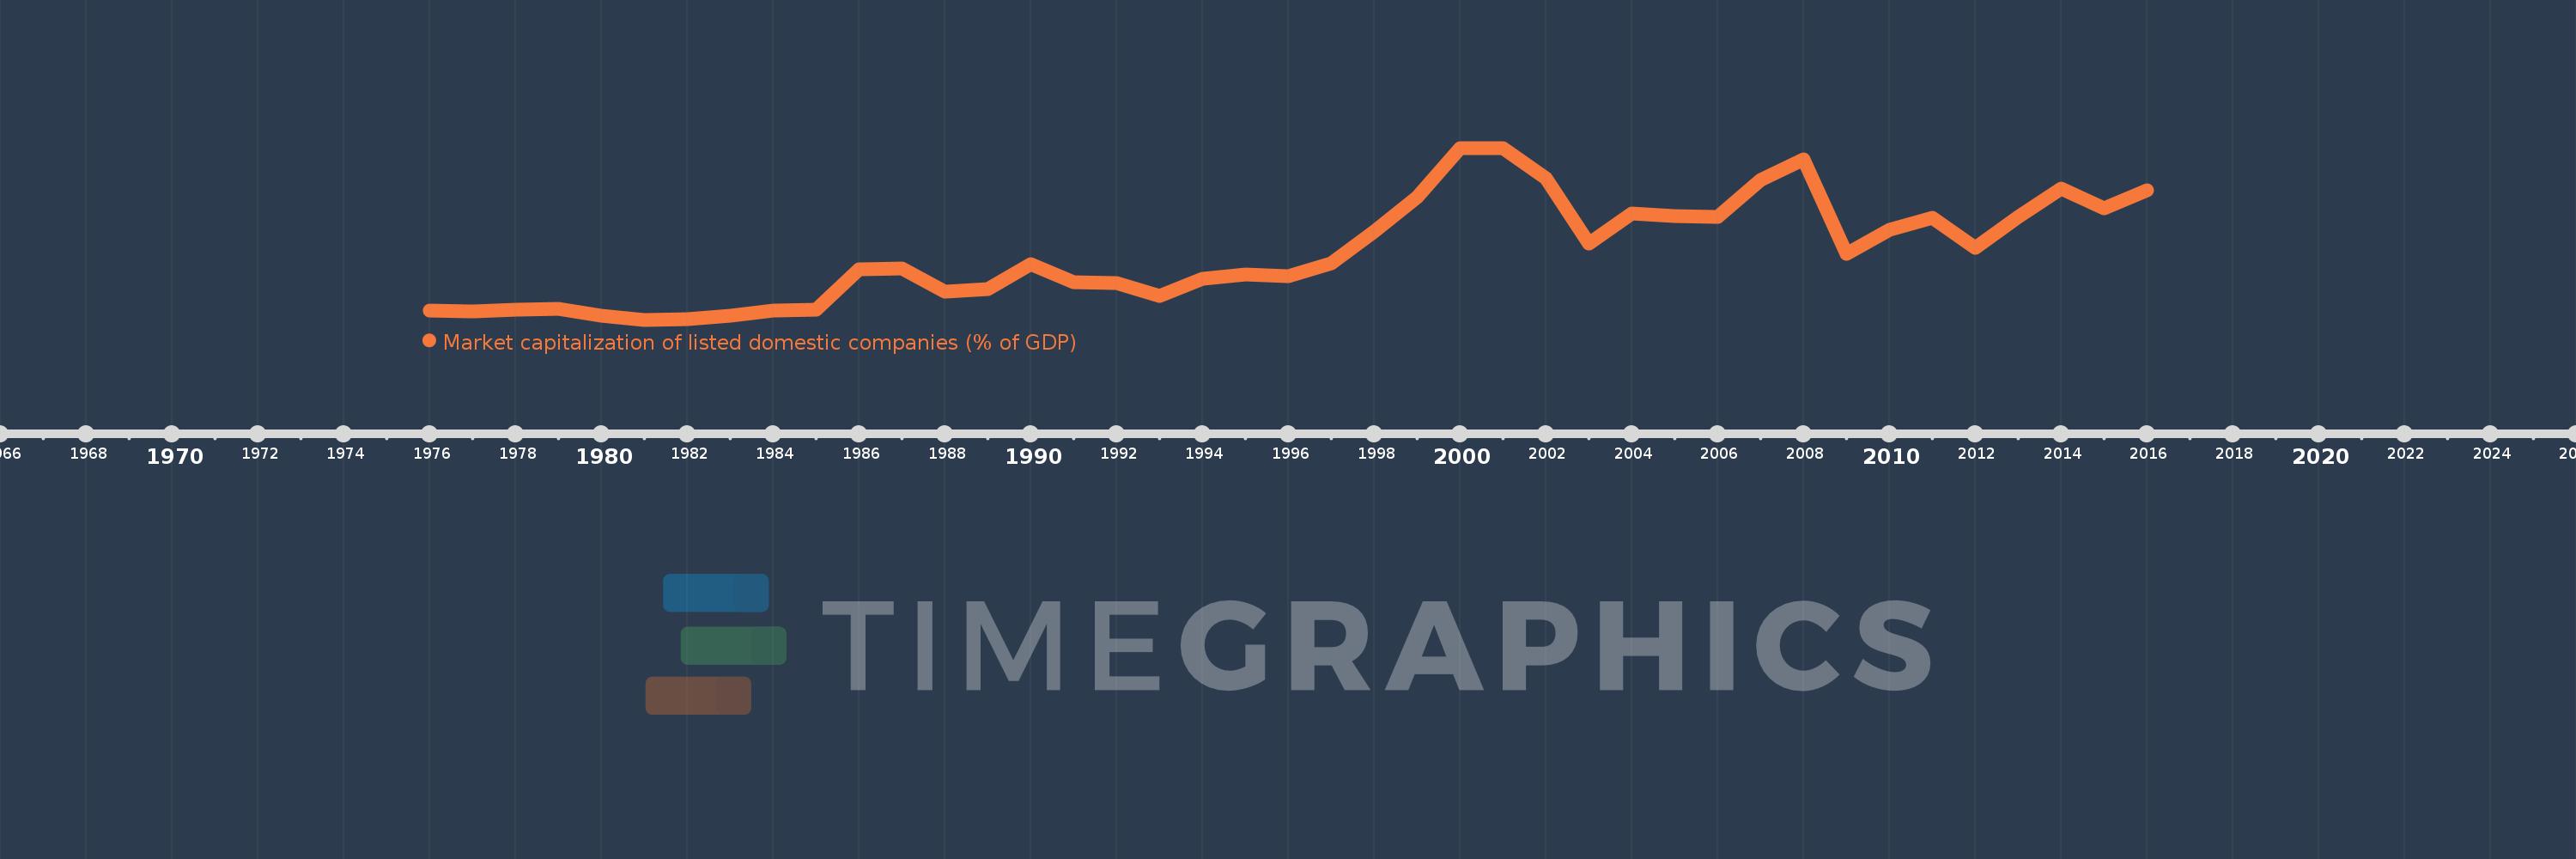
Market capitalization of listed domestic companies (% of GDP)
2016,2015,2014,2013,2012,2011,2010,2009,2008,2007,2006,2005,2004,2003,2002,2001,2000,1999,1998,1997,1996,1995,1994,1993,1992,1991,1990,1989,1988,1987,1986,1985,1984,1983,1982,1981,1980,1979,1978,1977,1976
This statistics in other country:
Timeline:
This timeline shows a graph from 1976 to 2016 of Germany. No data until 1975. Number of actual observations by date: 41.
Source name:
World Development Indicators
Source organization:
World Federation of Exchanges database.
Categories, topics:
Financial Sector
Last updated:
apr 23, 2017
Indicators value changes by year
Maximum:
65.142
jan 1, 2001
At the date of observation
Value
Absolute change
Change from previous value
jan 1, 1976
10.516
+10.516
0.0%
jan 1, 1977
10.313
-0.203
-1.93%
jan 1, 1978
10.882
+0.569
5.52%
jan 1, 1979
11.345
+0.463
4.26%
jan 1, 1980
9.043
-2.302
-20.29%
jan 1, 1981
7.575
-1.468
-16.23%
jan 1, 1982
7.848
+0.273
3.6%
jan 1, 1983
8.913
+1.065
13.57%
jan 1, 1984
10.794
+1.881
21.1%
jan 1, 1985
10.849
+0.055
0.51%
jan 1, 1986
24.43
+13.582
125.19%
jan 1, 1987
24.722
+0.292
1.19%
jan 1, 1988
16.892
-7.83
-31.67%
jan 1, 1989
17.971
+1.079
6.39%
jan 1, 1990
26.202
+8.231
45.8%
jan 1, 1991
20.131
-6.071
-23.17%
jan 1, 1992
19.905
-0.226
-1.12%
jan 1, 1993
15.481
-4.424
-22.22%
jan 1, 1994
21.353
+5.871
37.93%
jan 1, 1995
22.629
+1.276
5.98%
jan 1, 1996
22.278
-0.351
-1.55%
jan 1, 1997
26.552
+4.274
19.18%
jan 1, 1998
37.195
+10.642
40.08%
jan 1, 1999
48.78
+11.586
31.15%
jan 1, 2000
65.1
+16.319
33.45%
jan 1, 2001
65.142
+0.042
0.07%
jan 1, 2002
54.943
-10.199
-15.66%
jan 1, 2003
32.995
-21.948
-39.95%
jan 1, 2004
43.062
+10.067
30.51%
jan 1, 2005
42.37
-0.692
-1.61%
jan 1, 2006
42.012
-0.358
-0.85%
jan 1, 2007
54.543
+12.53
29.83%
jan 1, 2008
61.198
+6.656
12.2%
jan 1, 2009
29.597
-31.602
-51.64%
jan 1, 2010
37.81
+8.213
27.75%
jan 1, 2011
41.838
+4.027
10.65%
jan 1, 2012
31.524
-10.314
-24.65%
jan 1, 2013
41.939
+10.415
33.04%
jan 1, 2014
51.595
+9.656
23.02%
jan 1, 2015
44.816
-6.779
-13.14%
jan 1, 2016
51.013
+6.197
13.83%
Ranking of countries by current statistics by years


Comments: