29
/
en
AIzaSyAYiBZKx7MnpbEhh9jyipgxe19OcubqV5w
April 1, 2024
105129
Chile
CHL
true
2
1
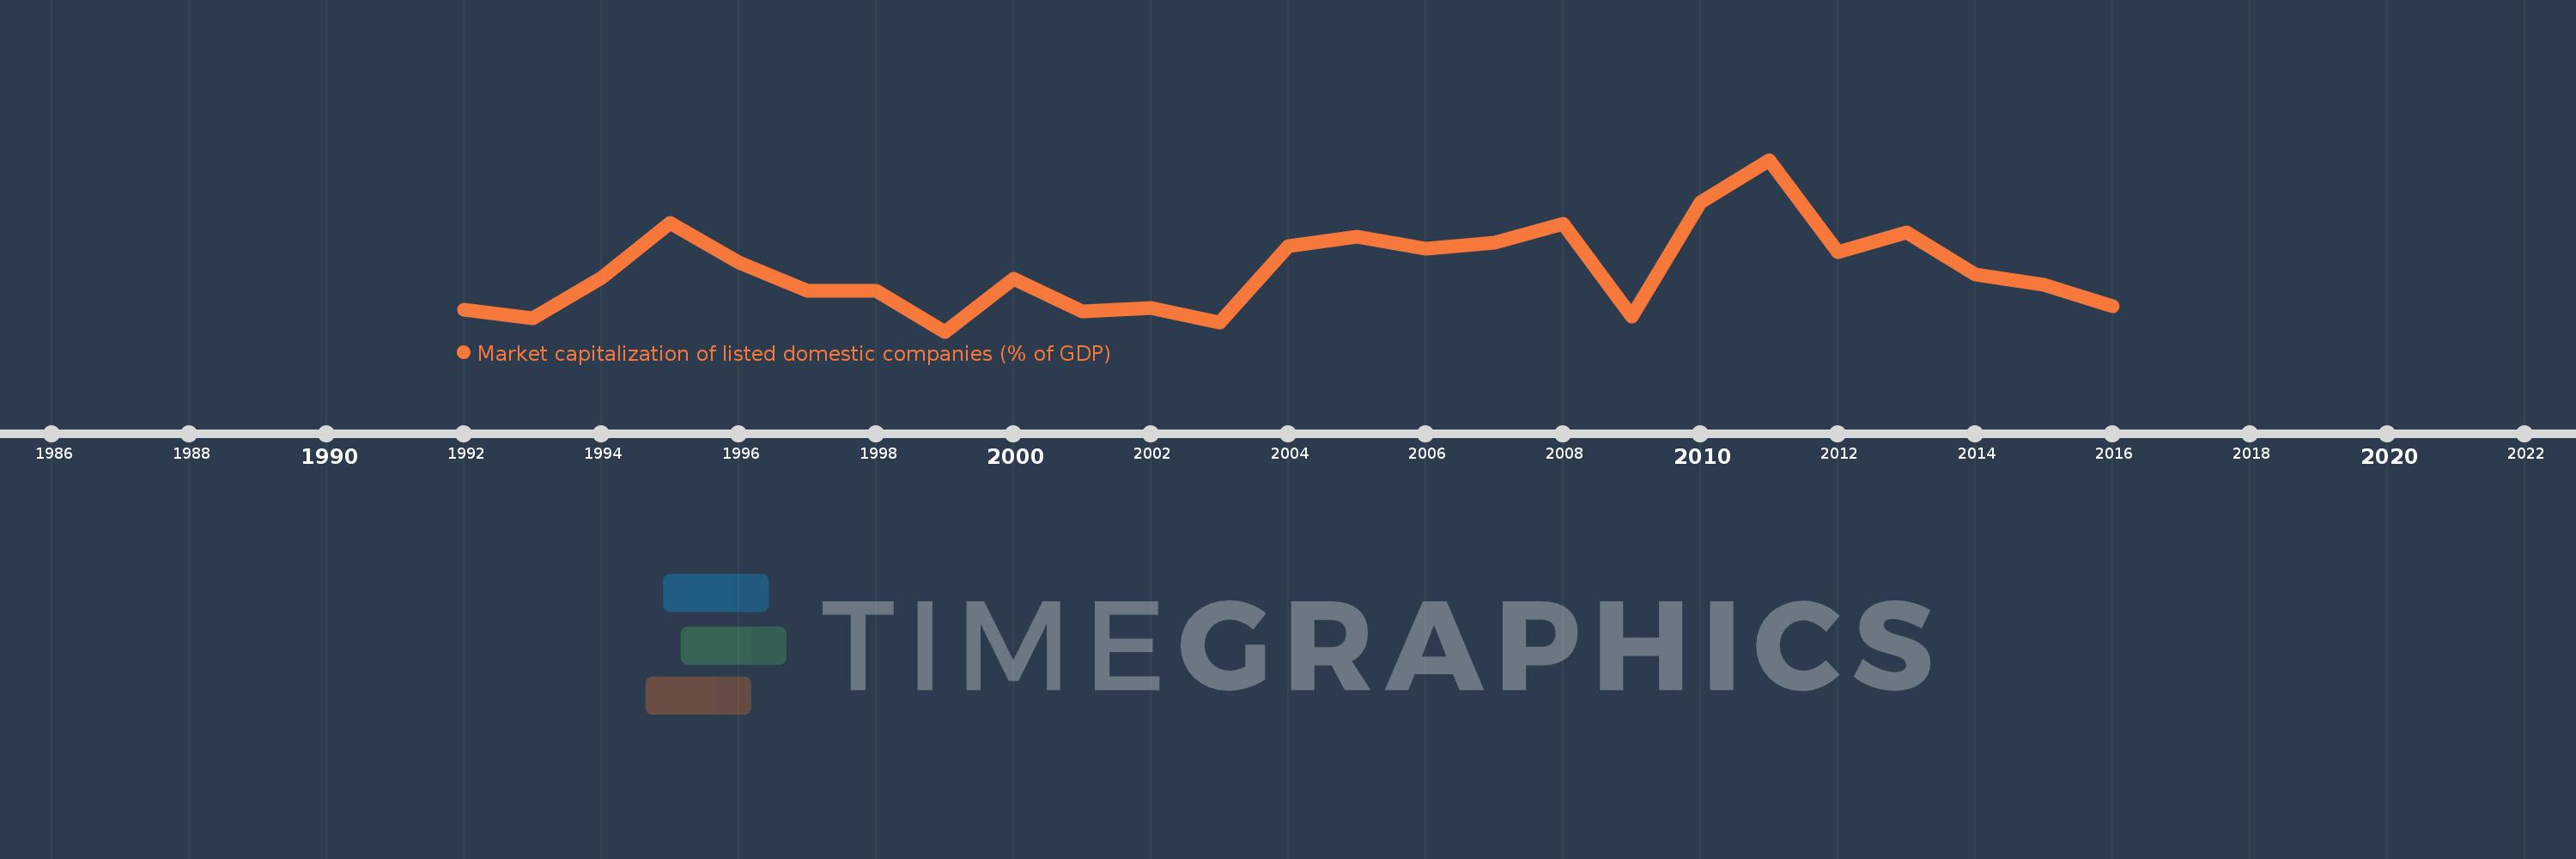
Market capitalization of listed domestic companies (% of GDP)
2016,2015,2014,2013,2012,2011,2010,2009,2008,2007,2006,2005,2004,2003,2002,2001,2000,1999,1998,1997,1996,1995,1994,1993,1992
This statistics in other country:
Timeline:
This timeline shows a graph from 1992 to 2016 of Chile. No data until 1991. Number of actual observations by date: 25.
Source name:
World Development Indicators
Source organization:
World Federation of Exchanges database.
Categories, topics:
Financial Sector
Last updated:
apr 23, 2017
Indicators value changes by year
Minimum:
65.344
jan 1, 1999
Maximum:
157.121
jan 1, 2011
At the date of observation
Value
Absolute change
Change from previous value
jan 1, 1992
77.252
+77.252
0.0%
jan 1, 1993
72.539
-4.713
-6.1%
jan 1, 1994
94.002
+21.463
29.59%
jan 1, 1995
123.382
+29.38
31.25%
jan 1, 1996
102.212
-21.17
-17.16%
jan 1, 1997
87.069
-15.143
-14.82%
jan 1, 1998
87.003
-0.066
-0.08%
jan 1, 1999
65.344
-21.658
-24.89%
jan 1, 2000
93.468
+28.124
43.04%
jan 1, 2001
76.14
-17.328
-18.54%
jan 1, 2002
77.844
+1.704
2.24%
jan 1, 2003
70.194
-7.649
-9.83%
jan 1, 2004
111.158
+40.964
58.36%
jan 1, 2005
116.191
+5.033
4.53%
jan 1, 2006
109.718
-6.474
-5.57%
jan 1, 2007
112.768
+3.05
2.78%
jan 1, 2008
123.012
+10.244
9.08%
jan 1, 2009
73.379
-49.633
-40.35%
jan 1, 2010
134.18
+60.801
82.86%
jan 1, 2011
157.121
+22.941
17.1%
jan 1, 2012
107.757
-49.364
-31.42%
jan 1, 2013
118.133
+10.376
9.63%
jan 1, 2014
95.695
-22.438
-18.99%
jan 1, 2015
90.149
-5.546
-5.8%
jan 1, 2016
79.051
-11.098
-12.31%
Ranking of countries by current statistics by years


Comments: