29
/
en
AIzaSyAYiBZKx7MnpbEhh9jyipgxe19OcubqV5w
April 1, 2024
81986
Belgium
BEL
true
2
1
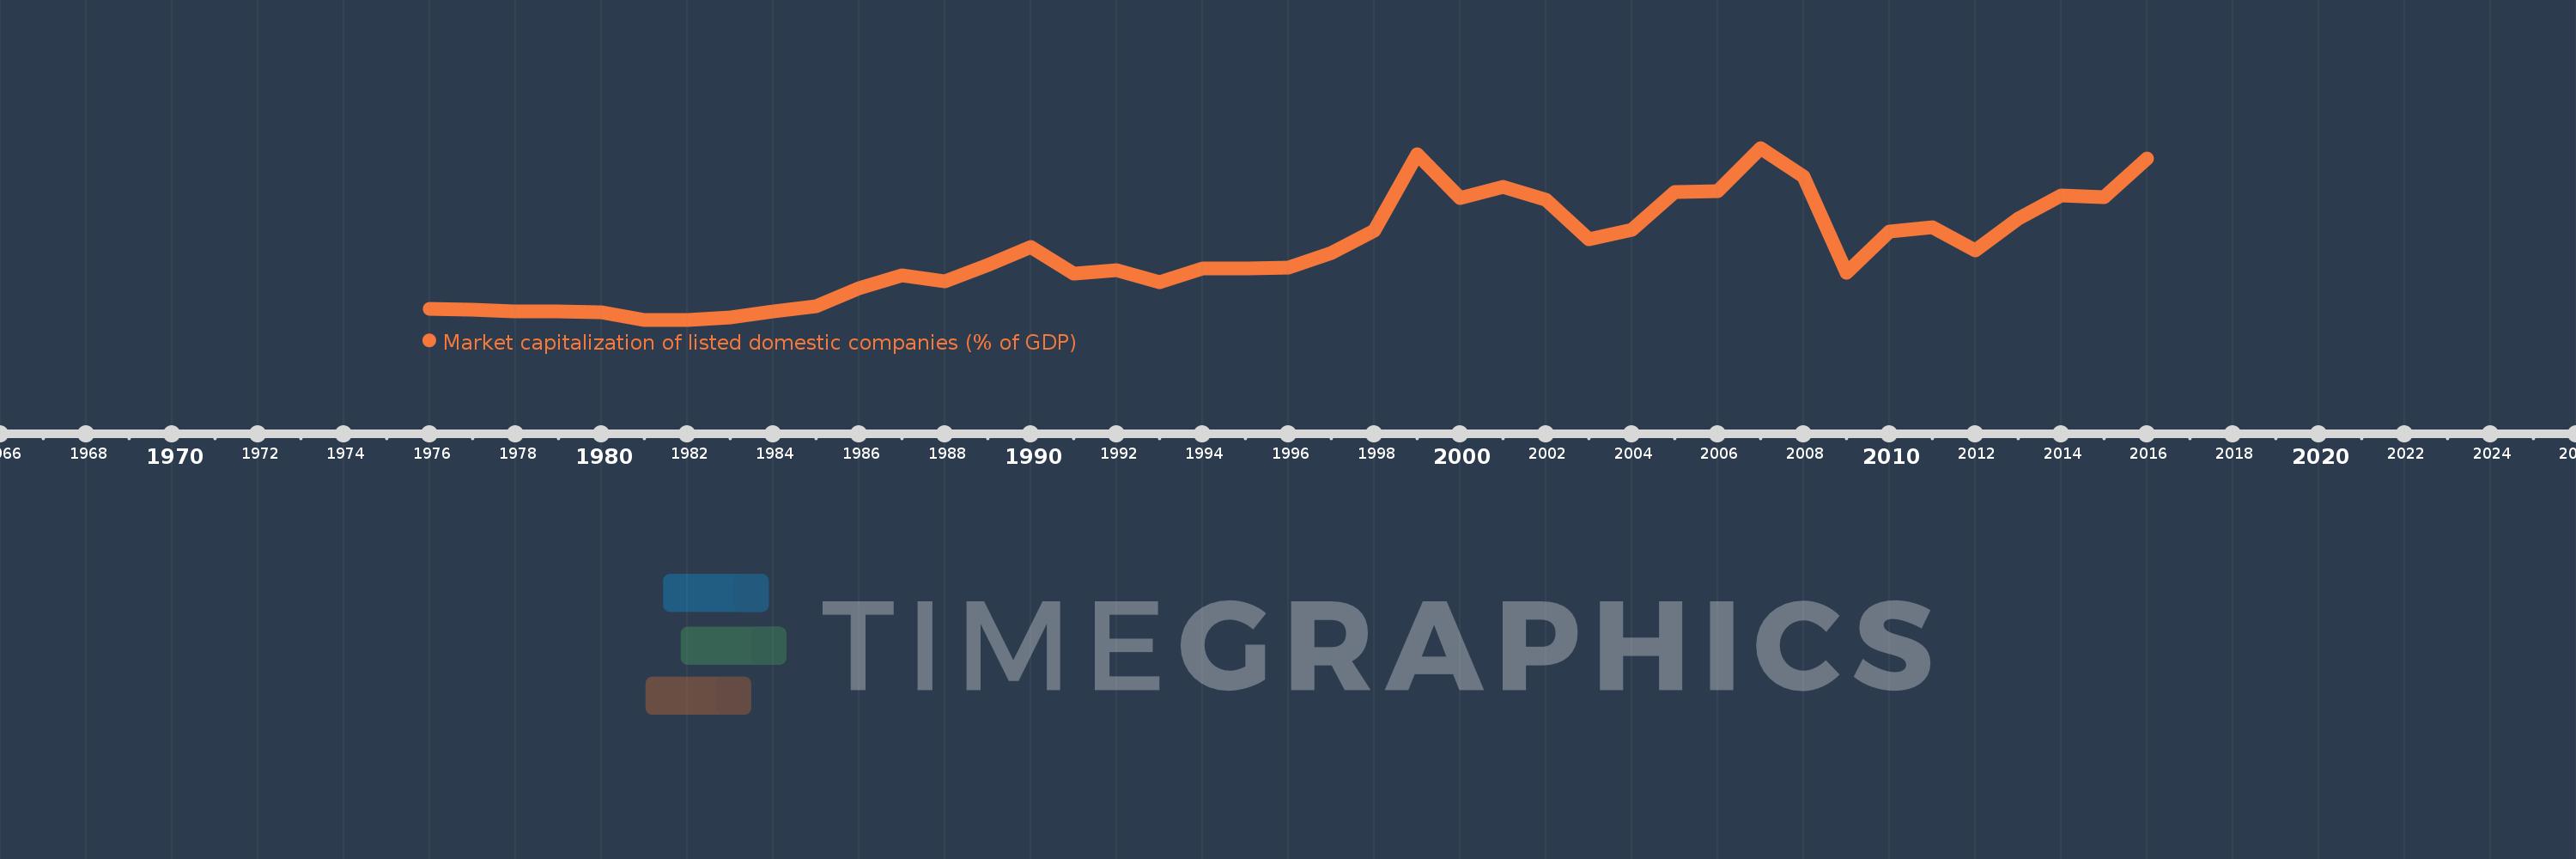
Market capitalization of listed domestic companies (% of GDP)
2016,2015,2014,2013,2012,2011,2010,2009,2008,2007,2006,2005,2004,2003,2002,2001,2000,1999,1998,1997,1996,1995,1994,1993,1992,1991,1990,1989,1988,1987,1986,1985,1984,1983,1982,1981,1980,1979,1978,1977,1976
This statistics in other country:
Timeline:
This timeline shows a graph from 1976 to 2016 of Belgium. No data until 1975. Number of actual observations by date: 41.
Source name:
World Development Indicators
Source organization:
World Federation of Exchanges database.
Categories, topics:
Financial Sector
Last updated:
apr 23, 2017
Indicators value changes by year
At the date of observation
Value
Absolute change
Change from previous value
jan 1, 1976
13.63
+13.63
0.0%
jan 1, 1977
13.148
-0.482
-3.54%
jan 1, 1978
12.357
-0.791
-6.02%
jan 1, 1979
12.287
-0.07
-0.56%
jan 1, 1980
11.745
-0.542
-4.41%
jan 1, 1981
7.869
-3.876
-33.0%
jan 1, 1982
7.949
+0.08
1.02%
jan 1, 1983
9.251
+1.302
16.38%
jan 1, 1984
12.298
+3.047
32.94%
jan 1, 1985
14.729
+2.431
19.77%
jan 1, 1986
24.065
+9.336
63.39%
jan 1, 1987
30.944
+6.879
28.58%
jan 1, 1988
27.73
-3.214
-10.39%
jan 1, 1989
36.028
+8.298
29.93%
jan 1, 1990
45.352
+9.324
25.88%
jan 1, 1991
31.705
-13.647
-30.09%
jan 1, 1992
33.602
+1.896
5.98%
jan 1, 1993
27.159
-6.443
-19.17%
jan 1, 1994
34.514
+7.355
27.08%
jan 1, 1995
34.17
-0.344
-1.0%
jan 1, 1996
35.025
+0.855
2.5%
jan 1, 1997
42.224
+7.199
20.55%
jan 1, 1998
53.739
+11.515
27.27%
jan 1, 1999
93.644
+39.905
74.26%
jan 1, 2000
70.766
-22.878
-24.43%
jan 1, 2001
76.703
+5.937
8.39%
jan 1, 2002
69.728
-6.975
-9.09%
jan 1, 2003
49.276
-20.452
-29.33%
jan 1, 2004
54.405
+5.129
10.41%
jan 1, 2005
73.674
+19.27
35.42%
jan 1, 2006
74.473
+0.798
1.08%
jan 1, 2007
96.67
+22.198
29.81%
jan 1, 2008
81.716
-14.954
-15.47%
jan 1, 2009
32.243
-49.473
-60.54%
jan 1, 2010
53.61
+21.367
66.27%
jan 1, 2011
55.571
+1.961
3.66%
jan 1, 2012
43.516
-12.054
-21.69%
jan 1, 2013
60.158
+16.642
38.24%
jan 1, 2014
71.973
+11.815
19.64%
jan 1, 2015
71.183
-0.79
-1.1%
jan 1, 2016
91.094
+19.911
27.97%
Ranking of countries by current statistics by years


Comments: