29
/
en
AIzaSyAYiBZKx7MnpbEhh9jyipgxe19OcubqV5w
April 1, 2024
28321
East Asia & Pacific (excluding high income)
EAP
false
2
1
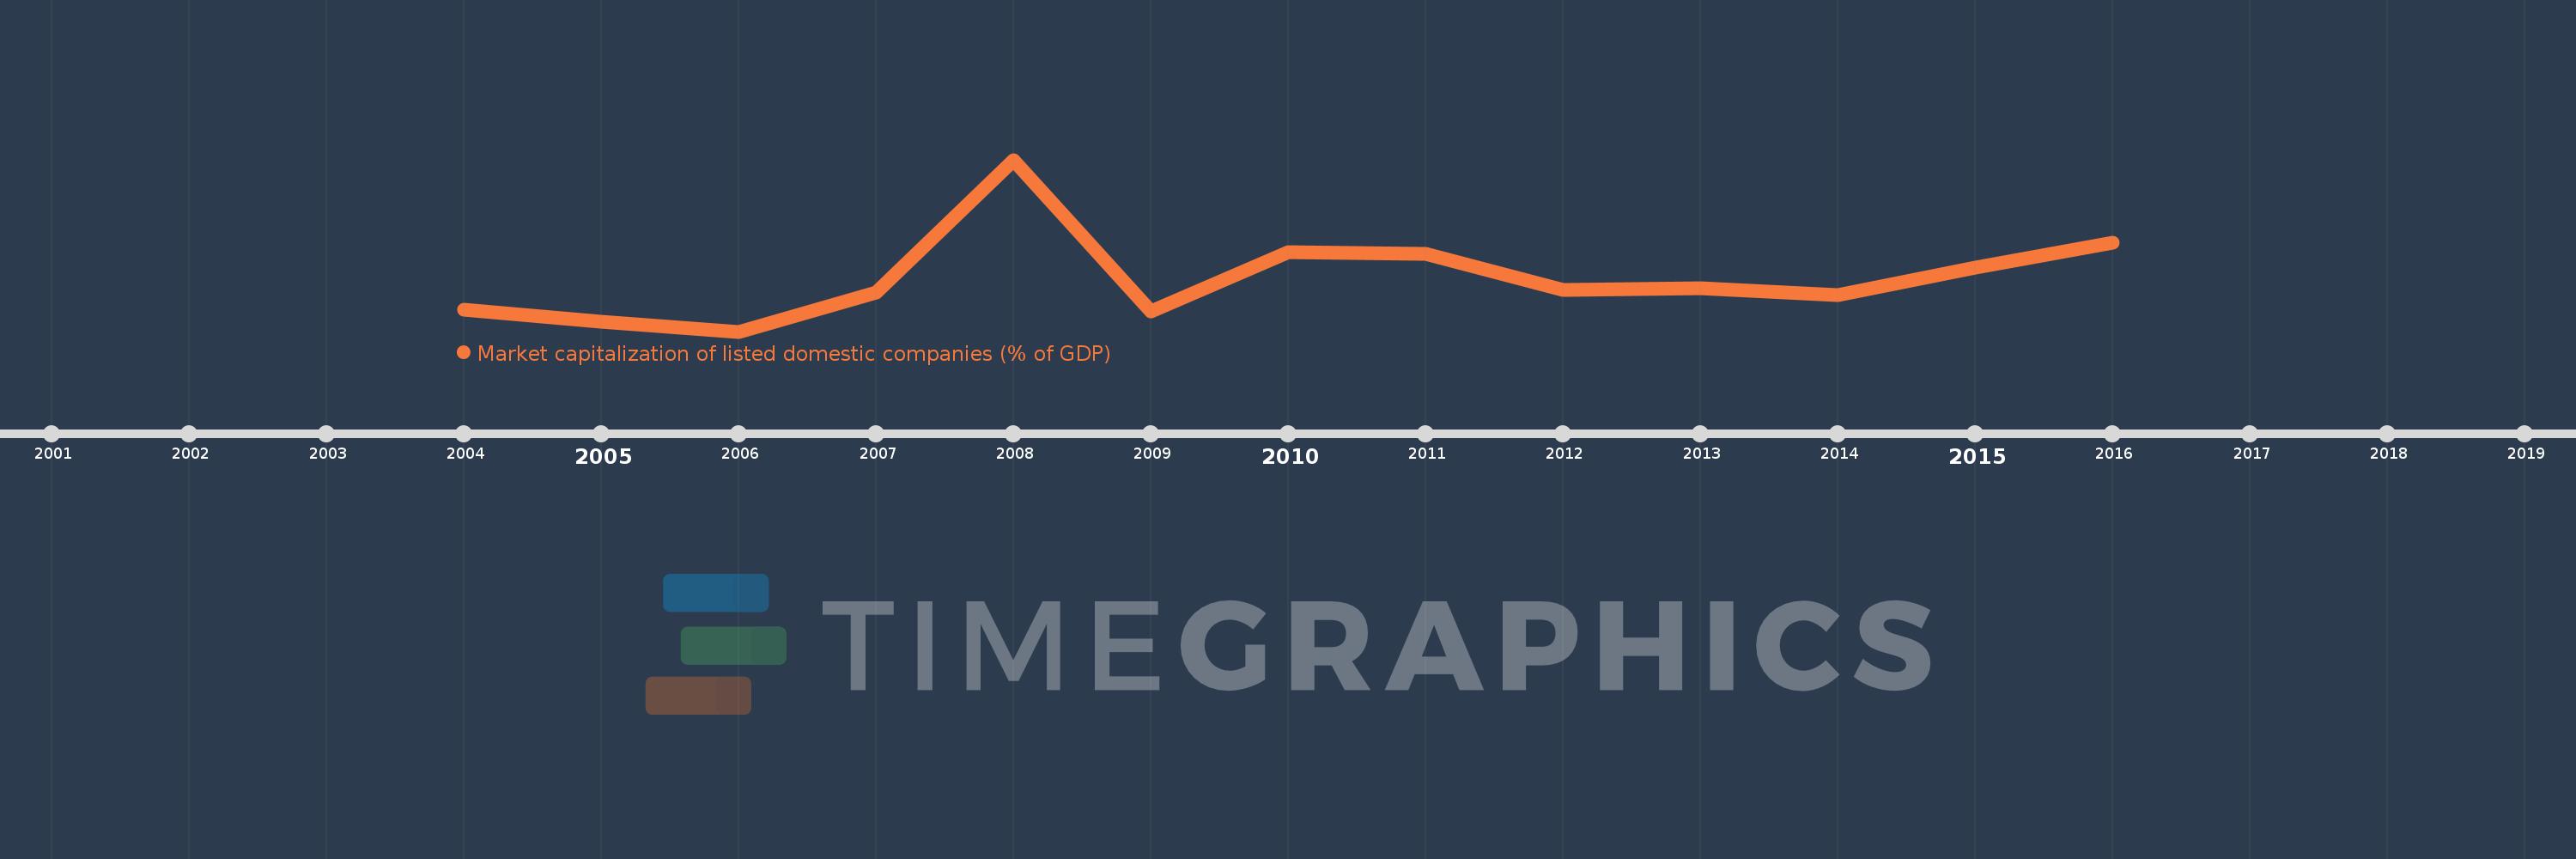
Market capitalization of listed domestic companies (% of GDP)
2016,2015,2014,2013,2012,2011,2010,2009,2008,2007,2006,2005,2004
This statistics in other country:
Timeline:
This timeline shows a graph from 2004 to 2016 of East Asia & Pacific (excluding high income). No data until 2003. Number of actual observations by date: 13.
Source name:
World Development Indicators
Source organization:
World Federation of Exchanges database.
Categories, topics:
Financial Sector
Last updated:
apr 23, 2017
Indicators value changes by year
Minimum:
27.641
jan 1, 2006
Maximum:
115.762
jan 1, 2008
At the date of observation
Value
Absolute change
Change from previous value
jan 1, 2004
38.867
+38.867
0.0%
jan 1, 2005
32.606
-6.261
-16.11%
jan 1, 2006
27.641
-4.965
-15.23%
jan 1, 2007
47.764
+20.123
72.8%
jan 1, 2008
115.762
+67.997
142.36%
jan 1, 2009
37.891
-77.87
-67.27%
jan 1, 2010
68.276
+30.385
80.19%
jan 1, 2011
67.734
-0.542
-0.79%
jan 1, 2012
49.024
-18.71
-27.62%
jan 1, 2013
49.854
+0.83
1.69%
jan 1, 2014
46.198
-3.656
-7.33%
jan 1, 2015
60.577
+14.379
31.12%
jan 1, 2016
73.302
+12.724
21.01%
Ranking of countries by current statistics by years


Comments: