29
/
en
AIzaSyAYiBZKx7MnpbEhh9jyipgxe19OcubqV5w
April 1, 2024
32806
Europe & Central Asia (IDA & IBRD countries)
TEC
false
2
1
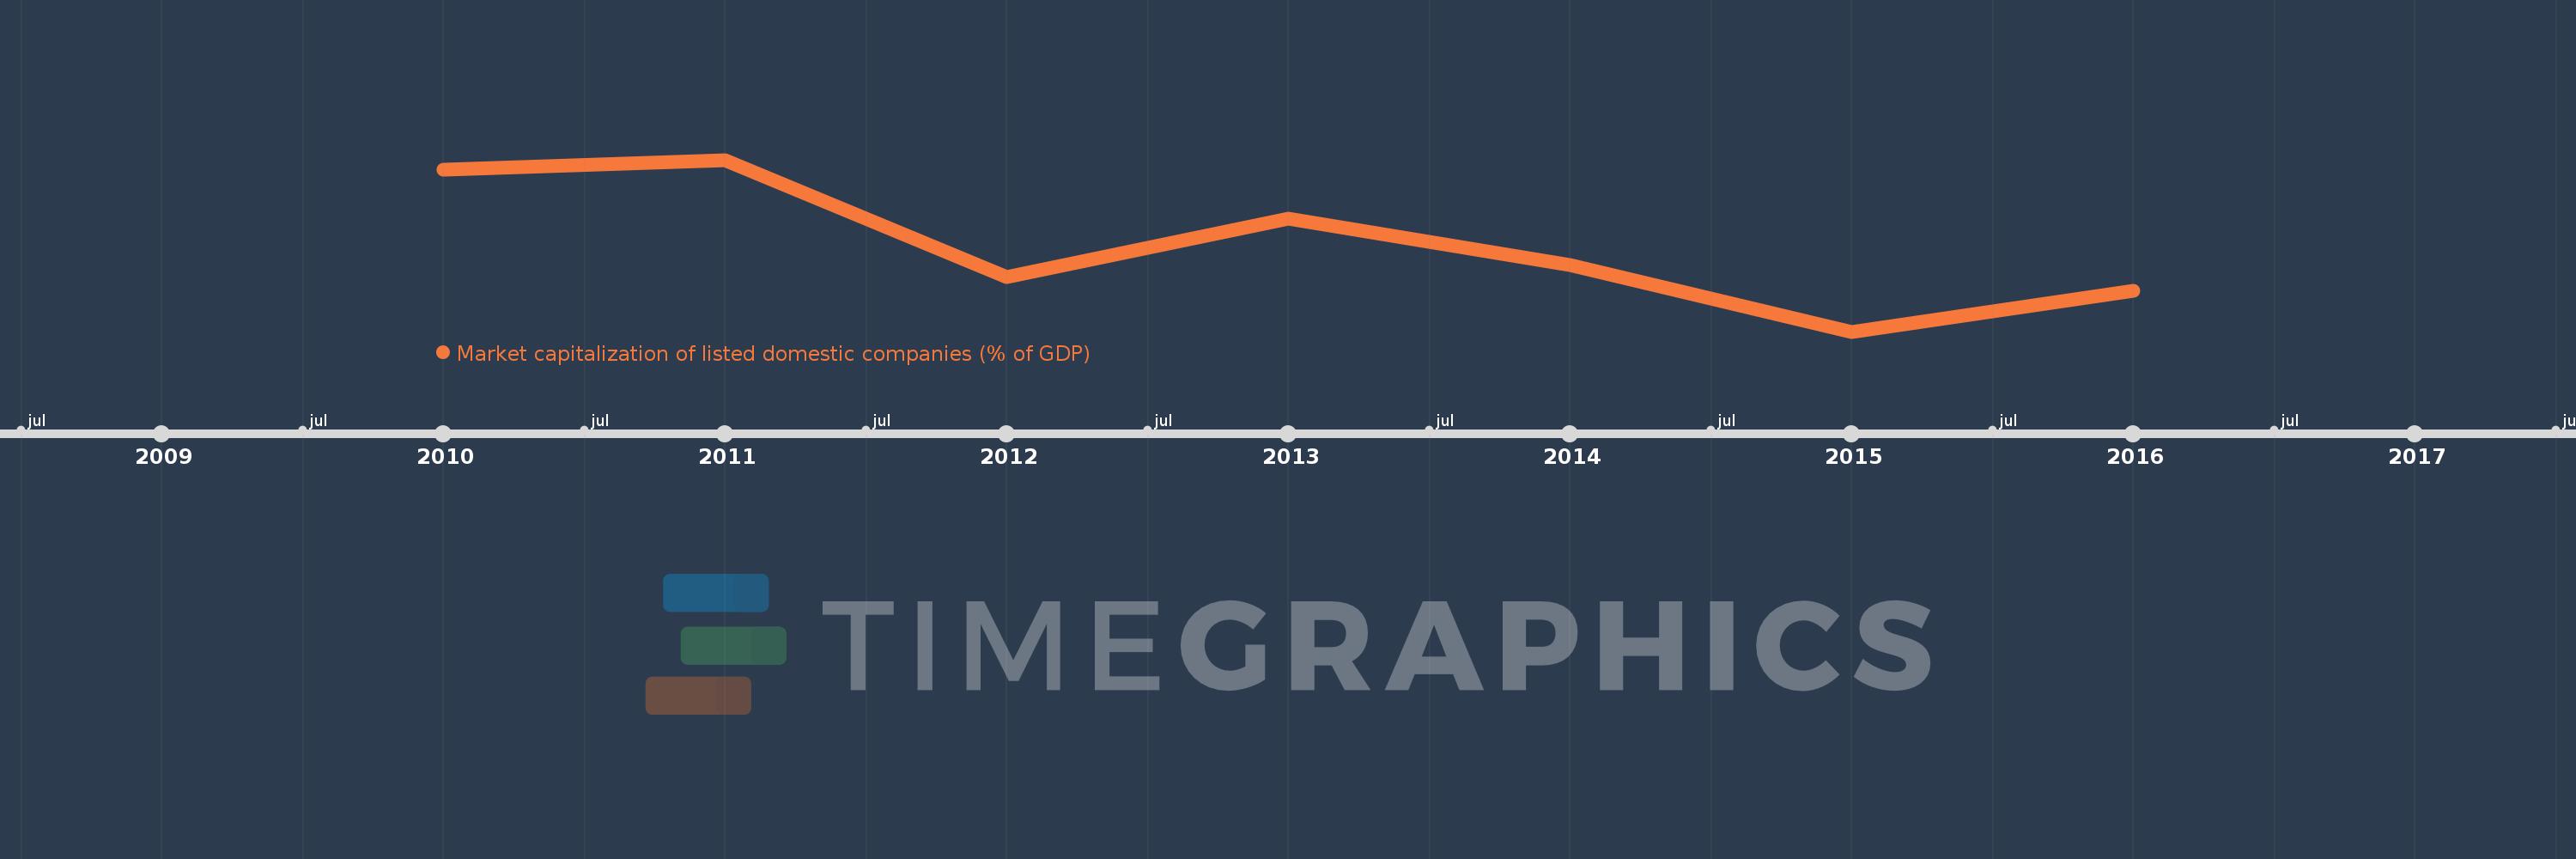
Market capitalization of listed domestic companies (% of GDP)
2016,2015,2014,2013,2012,2011,2010
This statistics in other country:
Timeline:
This timeline shows a graph from 2010 to 2016 of Europe & Central Asia (IDA & IBRD countries). No data until 2009. Number of actual observations by date: 7.
Source name:
World Development Indicators
Source organization:
World Federation of Exchanges database.
Categories, topics:
Financial Sector
Last updated:
apr 23, 2017
Indicators value changes by year
Minimum:
22.043
jan 1, 2015
Maximum:
46.238
jan 1, 2011
At the date of observation
Value
Absolute change
Change from previous value
jan 1, 2010
44.787
+44.787
0.0%
jan 1, 2011
46.238
+1.451
3.24%
jan 1, 2012
29.772
-16.466
-35.61%
jan 1, 2013
37.922
+8.15
27.38%
jan 1, 2014
31.373
-6.549
-17.27%
jan 1, 2015
22.043
-9.33
-29.74%
jan 1, 2016
27.845
+5.802
26.32%
Ranking of countries by current statistics by years


Comments: