29
/
en
AIzaSyAYiBZKx7MnpbEhh9jyipgxe19OcubqV5w
April 1, 2024
163997
Japan
JPN
true
2
1
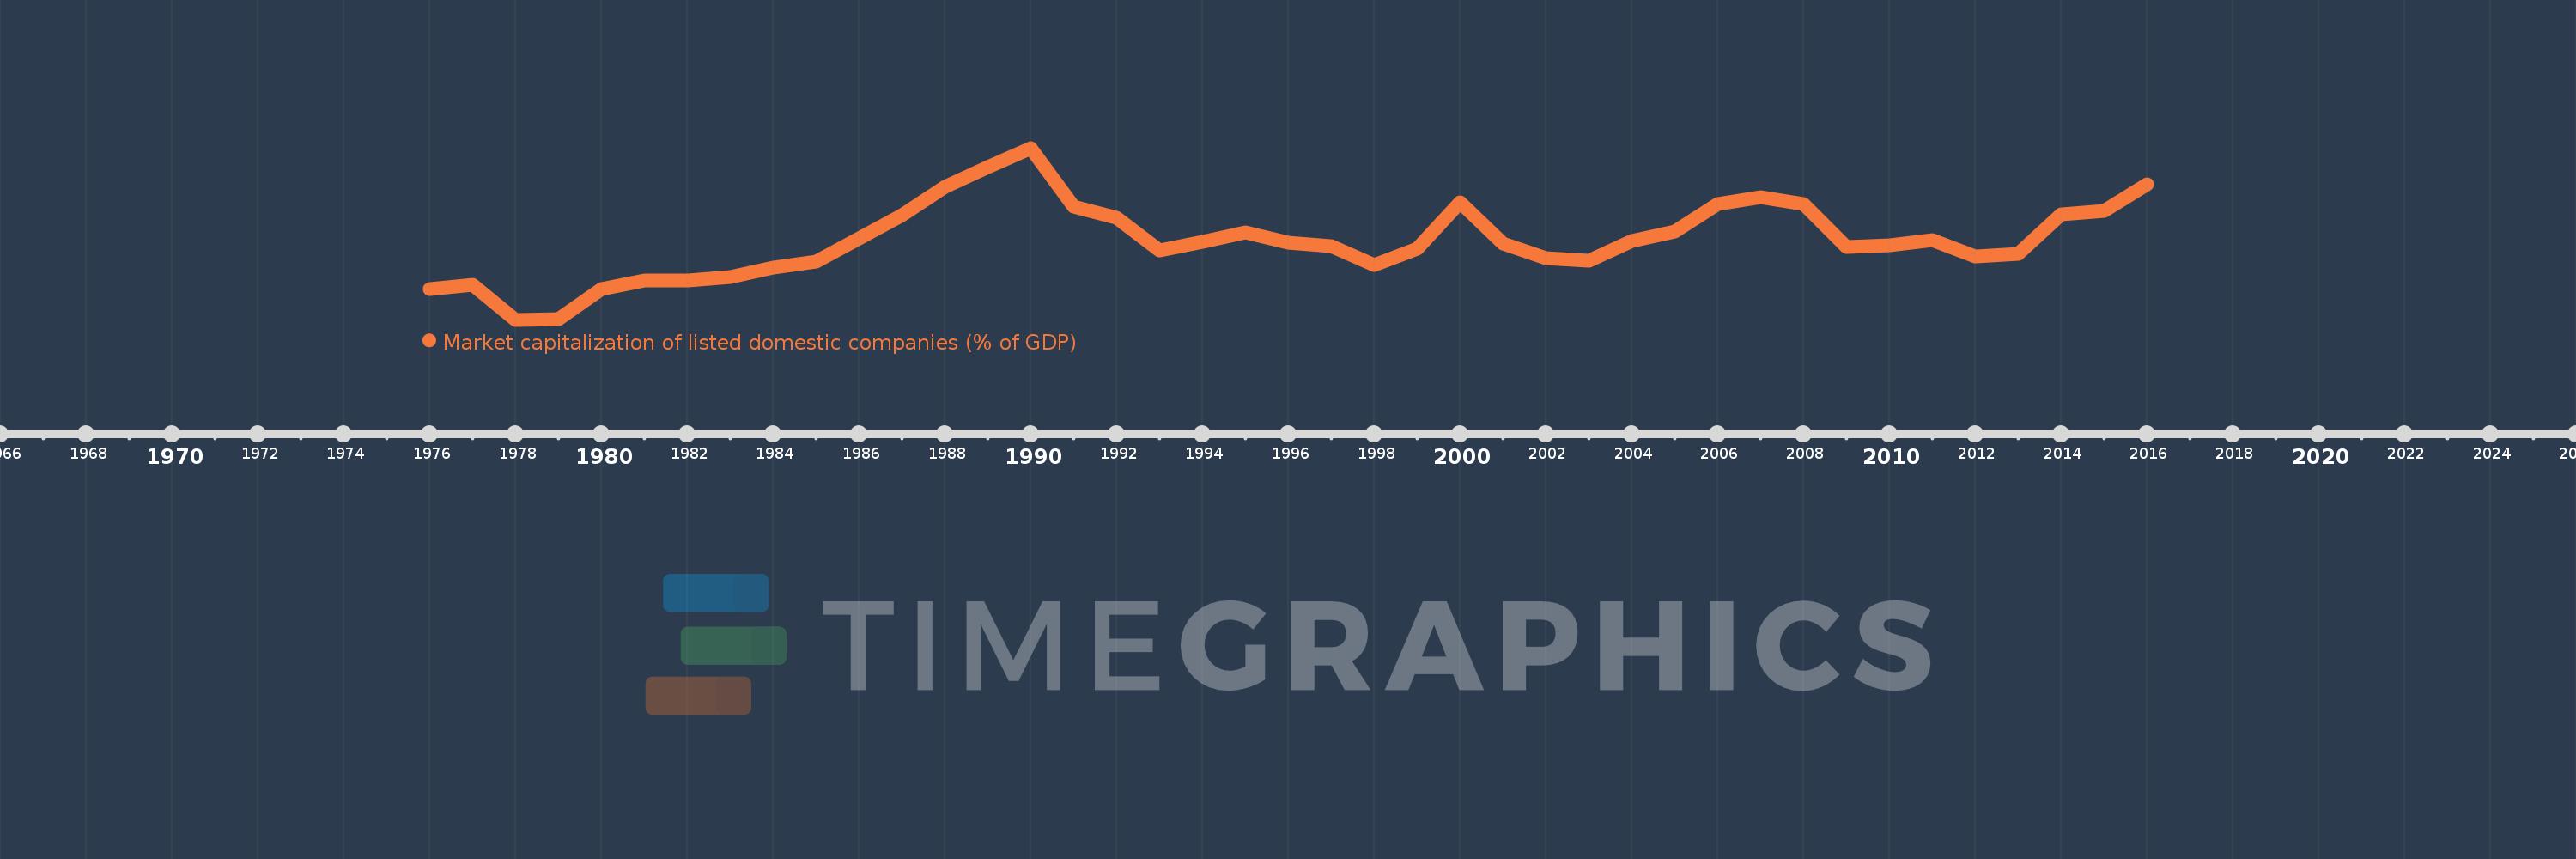
Market capitalization of listed domestic companies (% of GDP)
2016,2015,2014,2013,2012,2011,2010,2009,2008,2007,2006,2005,2004,2003,2002,2001,2000,1999,1998,1997,1996,1995,1994,1993,1992,1991,1990,1989,1988,1987,1986,1985,1984,1983,1982,1981,1980,1979,1978,1977,1976
This statistics in other country:
Timeline:
This timeline shows a graph from 1976 to 2016 of Japan. No data until 1975. Number of actual observations by date: 41.
Source name:
World Development Indicators
Source organization:
World Federation of Exchanges database.
Categories, topics:
Financial Sector
Last updated:
apr 23, 2017
Indicators value changes by year
Maximum:
141.21
jan 1, 1990
At the date of observation
Value
Absolute change
Change from previous value
jan 1, 1976
27.649
+27.649
0.0%
jan 1, 1977
31.384
+3.736
13.51%
jan 1, 1978
3.035
-28.349
-90.33%
jan 1, 1979
3.431
+0.396
13.05%
jan 1, 1980
27.869
+24.438
712.26%
jan 1, 1981
34.887
+7.018
25.18%
jan 1, 1982
34.786
-0.1
-0.29%
jan 1, 1983
37.374
+2.588
7.44%
jan 1, 1984
44.811
+7.437
19.9%
jan 1, 1985
49.777
+4.965
11.08%
jan 1, 1986
68.49
+18.713
37.59%
jan 1, 1987
86.962
+18.472
26.97%
jan 1, 1988
109.703
+22.741
26.15%
jan 1, 1989
125.656
+15.954
14.54%
jan 1, 1990
141.21
+15.554
12.38%
jan 1, 1991
94.356
-46.854
-33.18%
jan 1, 1992
84.984
-9.373
-9.93%
jan 1, 1993
58.525
-26.459
-31.13%
jan 1, 1994
65.828
+7.303
12.48%
jan 1, 1995
73.205
+7.377
11.21%
jan 1, 1996
65.062
-8.143
-11.12%
jan 1, 1997
62.472
-2.59
-3.98%
jan 1, 1998
47.237
-15.236
-24.39%
jan 1, 1999
60.497
+13.26
28.07%
jan 1, 2000
97.66
+37.163
61.43%
jan 1, 2001
64.598
-33.063
-33.85%
jan 1, 2002
52.62
-11.978
-18.54%
jan 1, 2003
50.285
-2.335
-4.44%
jan 1, 2004
66.427
+16.141
32.1%
jan 1, 2005
73.885
+7.458
11.23%
jan 1, 2006
96.162
+22.277
30.15%
jan 1, 2007
101.847
+5.685
5.91%
jan 1, 2008
95.917
-5.93
-5.82%
jan 1, 2009
61.847
-34.07
-35.52%
jan 1, 2010
63.197
+1.35
2.18%
jan 1, 2011
67.153
+3.956
6.26%
jan 1, 2012
54.006
-13.147
-19.58%
jan 1, 2013
56.081
+2.075
3.84%
jan 1, 2014
88.119
+32.038
57.13%
jan 1, 2015
90.292
+2.172
2.47%
jan 1, 2016
111.678
+21.386
23.69%
Ranking of countries by current statistics by years


Comments: