29
/
en
AIzaSyAYiBZKx7MnpbEhh9jyipgxe19OcubqV5w
April 1, 2024
237373
Serbia
SRB
true
2
1
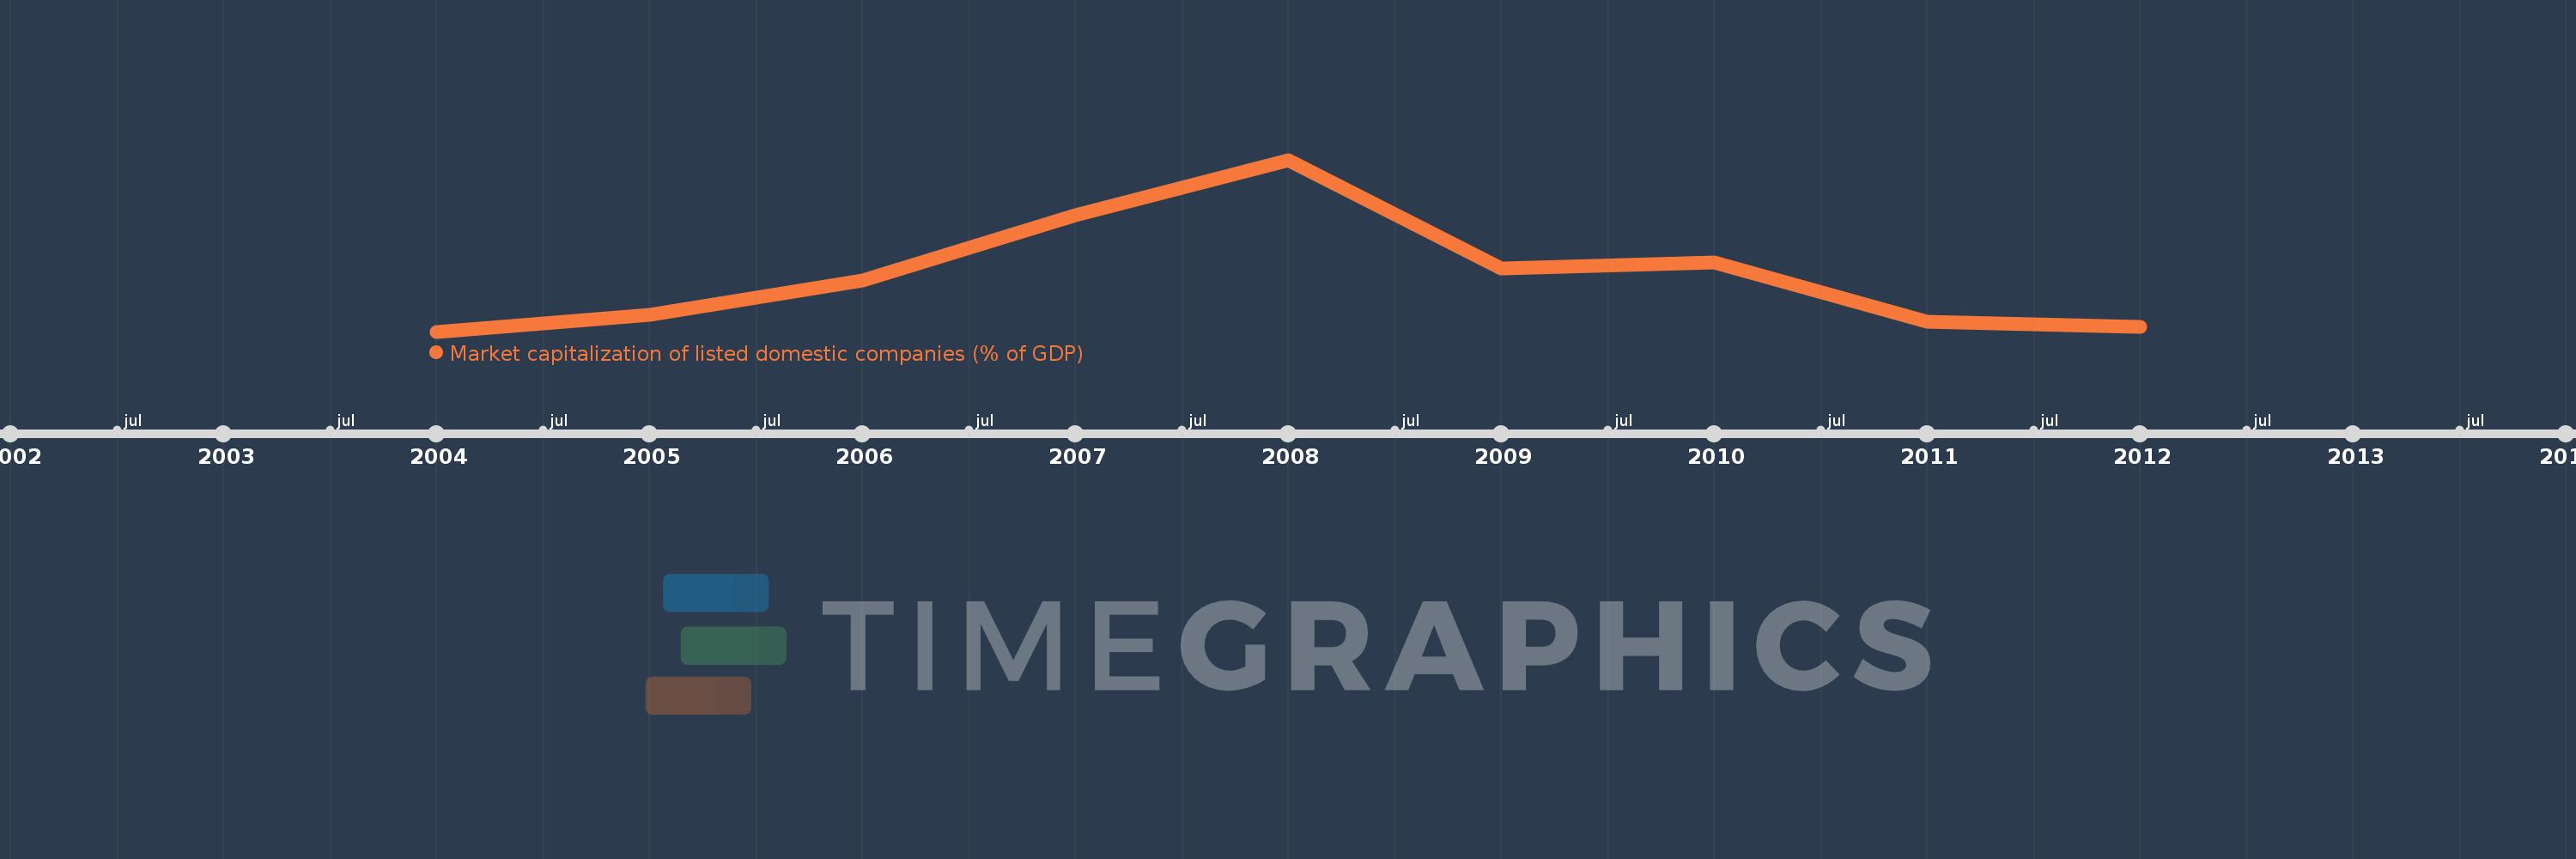
Market capitalization of listed domestic companies (% of GDP)
2012,2011,2010,2009,2008,2007,2006,2005,2004
This statistics in other country:
Timeline:
This timeline shows a graph from 2004 to 2012 of Serbia. No data until 2003. Number of actual observations by date: 9.
Source name:
World Development Indicators
Source organization:
World Federation of Exchanges database.
Categories, topics:
Financial Sector
Last updated:
apr 23, 2017
Indicators value changes by year
Maximum:
73.475
jan 1, 2008
At the date of observation
Value
Absolute change
Change from previous value
jan 1, 2004
6.733
+6.733
0.0%
jan 1, 2005
13.112
+6.379
94.75%
jan 1, 2006
26.652
+13.539
103.26%
jan 1, 2007
51.827
+25.175
94.46%
jan 1, 2008
73.475
+21.648
41.77%
jan 1, 2009
31.131
-42.344
-57.63%
jan 1, 2010
33.538
+2.407
7.73%
jan 1, 2011
10.538
-23.0
-68.58%
jan 1, 2012
8.728
-1.81
-17.18%
Ranking of countries by current statistics by years


Comments: