29
/
en
AIzaSyAYiBZKx7MnpbEhh9jyipgxe19OcubqV5w
April 1, 2024
50200
Middle East & North Africa (IDA & IBRD countries)
TMN
false
2
1
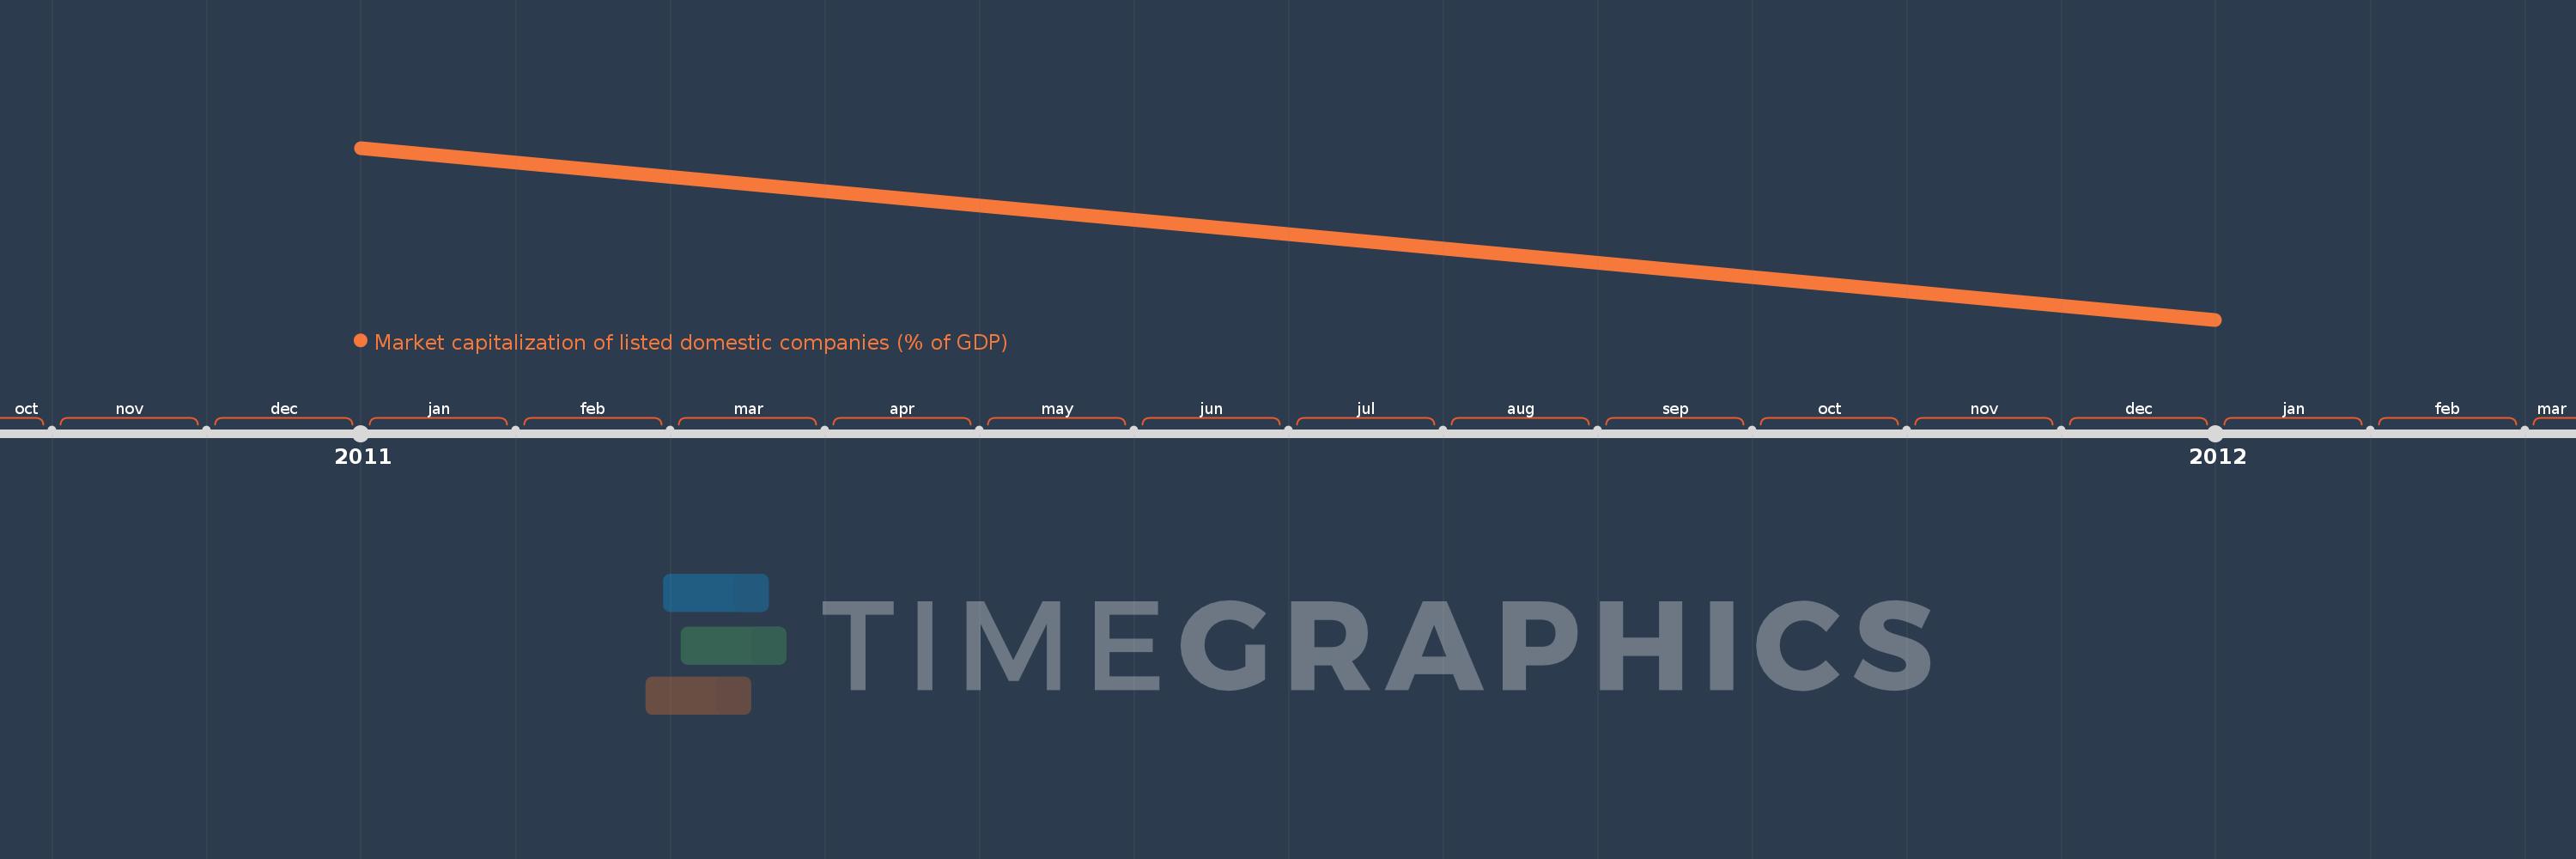
Market capitalization of listed domestic companies (% of GDP)
2012,2011
This statistics in other country:
Timeline:
This timeline shows a graph from 2011 to 2012 of Middle East & North Africa (IDA & IBRD countries). No data until 2010. Number of actual observations by date: 2.
Source name:
World Development Indicators
Source organization:
World Federation of Exchanges database.
Categories, topics:
Financial Sector
Last updated:
apr 23, 2017
Indicators value changes by year
Minimum:
25.085
jan 1, 2012
Maximum:
33.126
jan 1, 2011
At the date of observation
Value
Absolute change
Change from previous value
jan 1, 2011
33.126
+33.126
0.0%
jan 1, 2012
25.085
-8.041
-24.27%
Ranking of countries by current statistics by years


Comments: