29
/
en
AIzaSyAYiBZKx7MnpbEhh9jyipgxe19OcubqV5w
April 1, 2024
93835
Bulgaria
BGR
true
2
1
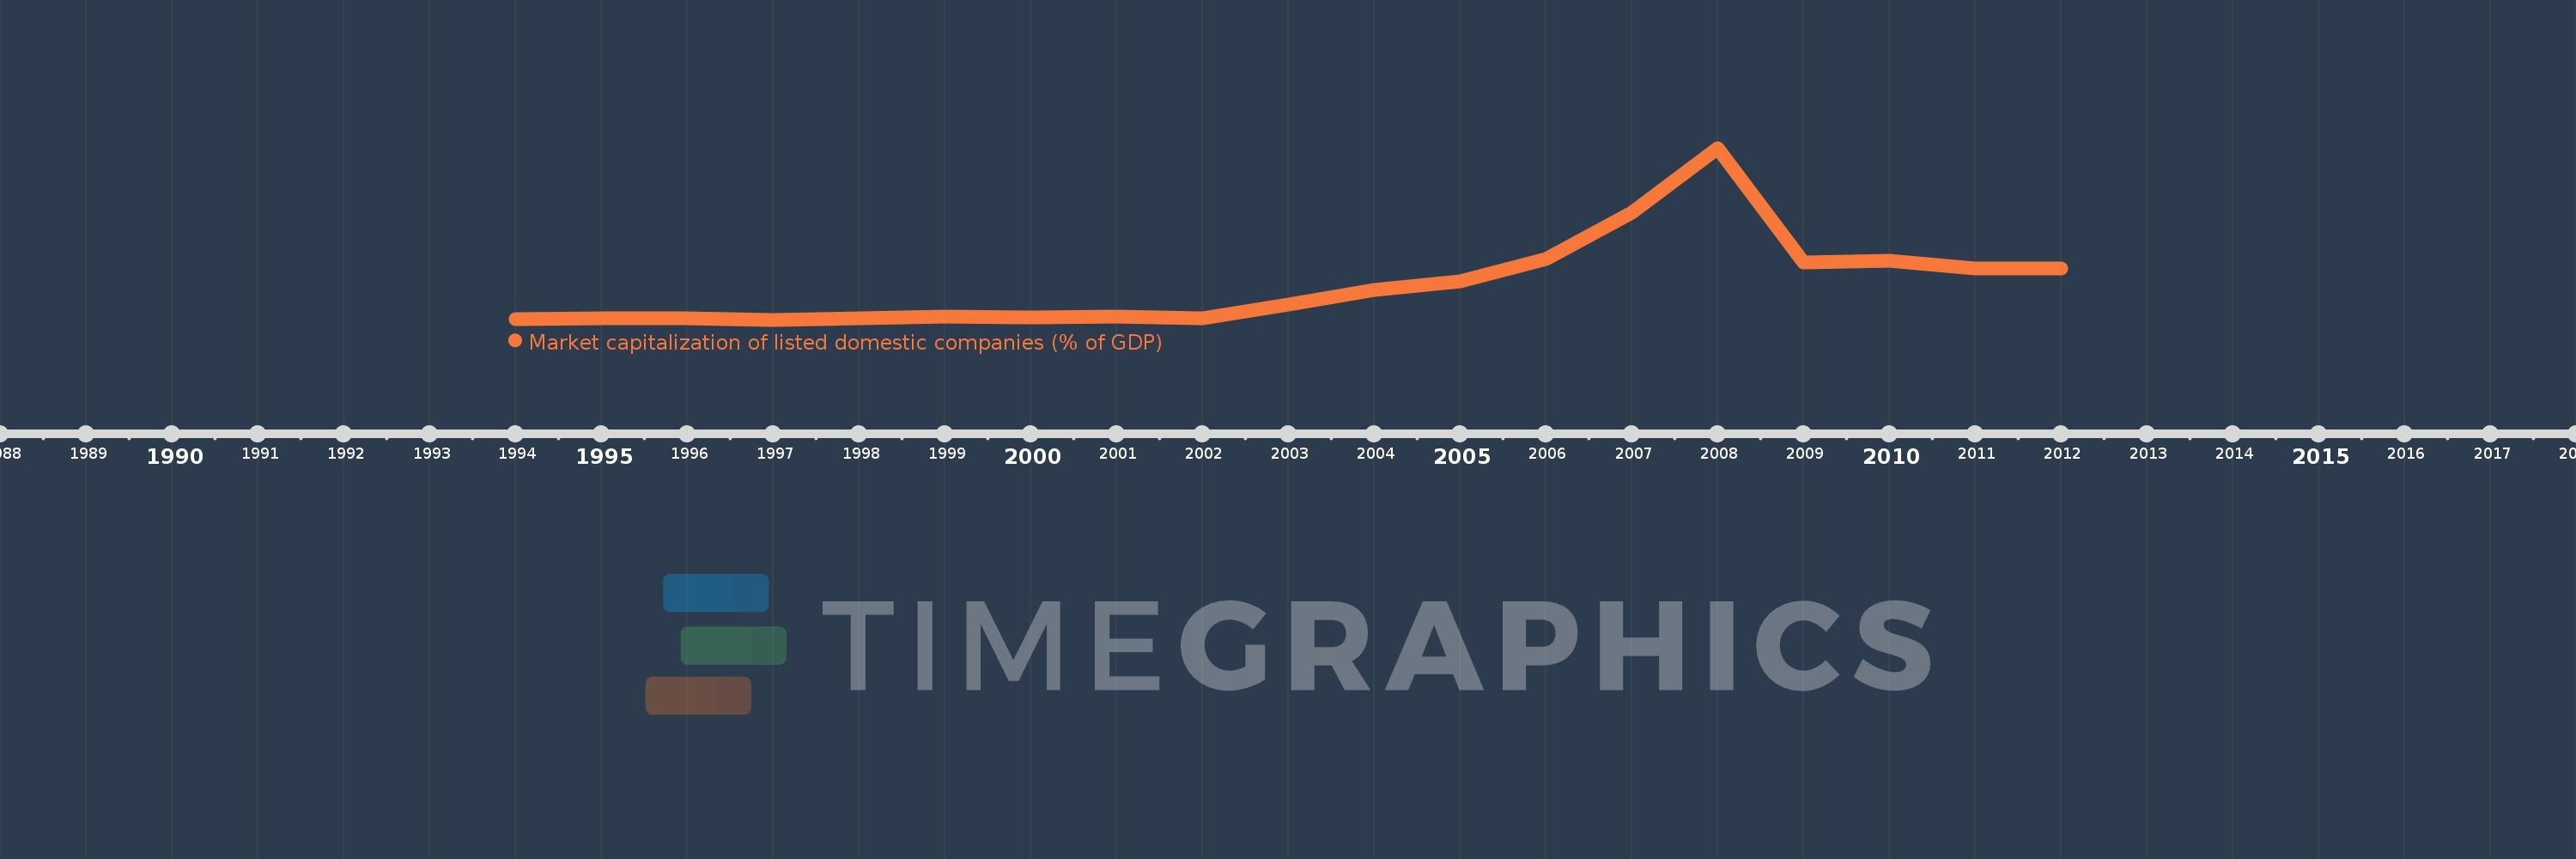
Market capitalization of listed domestic companies (% of GDP)
2012,2011,2010,2009,2008,2007,2006,2005,2004,2003,2002,2001,2000,1999,1997,1996,1995,1994
This statistics in other country:
Timeline:
This timeline shows a graph from 1994 to 2012 of Bulgaria. No data until 1993. Number of actual observations by date: 18.
Source name:
World Development Indicators
Source organization:
World Federation of Exchanges database.
Categories, topics:
Financial Sector
Last updated:
apr 23, 2017
Indicators value changes by year
Maximum:
48.402
jan 1, 2008
At the date of observation
Value
Absolute change
Change from previous value
jan 1, 1994
0.111
+0.111
0.0%
jan 1, 1995
0.498
+0.387
349.5%
jan 1, 1996
0.445
-0.053
-10.64%
jan 1, 1997
0.055
-0.39
-87.55%
jan 1, 1999
0.986
+0.931
1.68K%
jan 1, 2000
0.759
-0.227
-23.01%
jan 1, 2001
0.982
+0.222
29.28%
jan 1, 2002
0.582
-0.4
-40.77%
jan 1, 2003
4.411
+3.829
658.52%
jan 1, 2004
8.328
+3.917
88.81%
jan 1, 2005
10.745
+2.417
29.03%
jan 1, 2006
17.053
+6.308
58.71%
jan 1, 2007
30.098
+13.045
76.49%
jan 1, 2008
48.402
+18.304
60.82%
jan 1, 2009
16.245
-32.158
-66.44%
jan 1, 2010
16.71
+0.466
2.87%
jan 1, 2011
14.575
-2.135
-12.78%
jan 1, 2012
14.374
-0.201
-1.38%
Ranking of countries by current statistics by years


Comments: