29
/
en
AIzaSyAYiBZKx7MnpbEhh9jyipgxe19OcubqV5w
April 1, 2024
276881
United States
USA
true
2
1
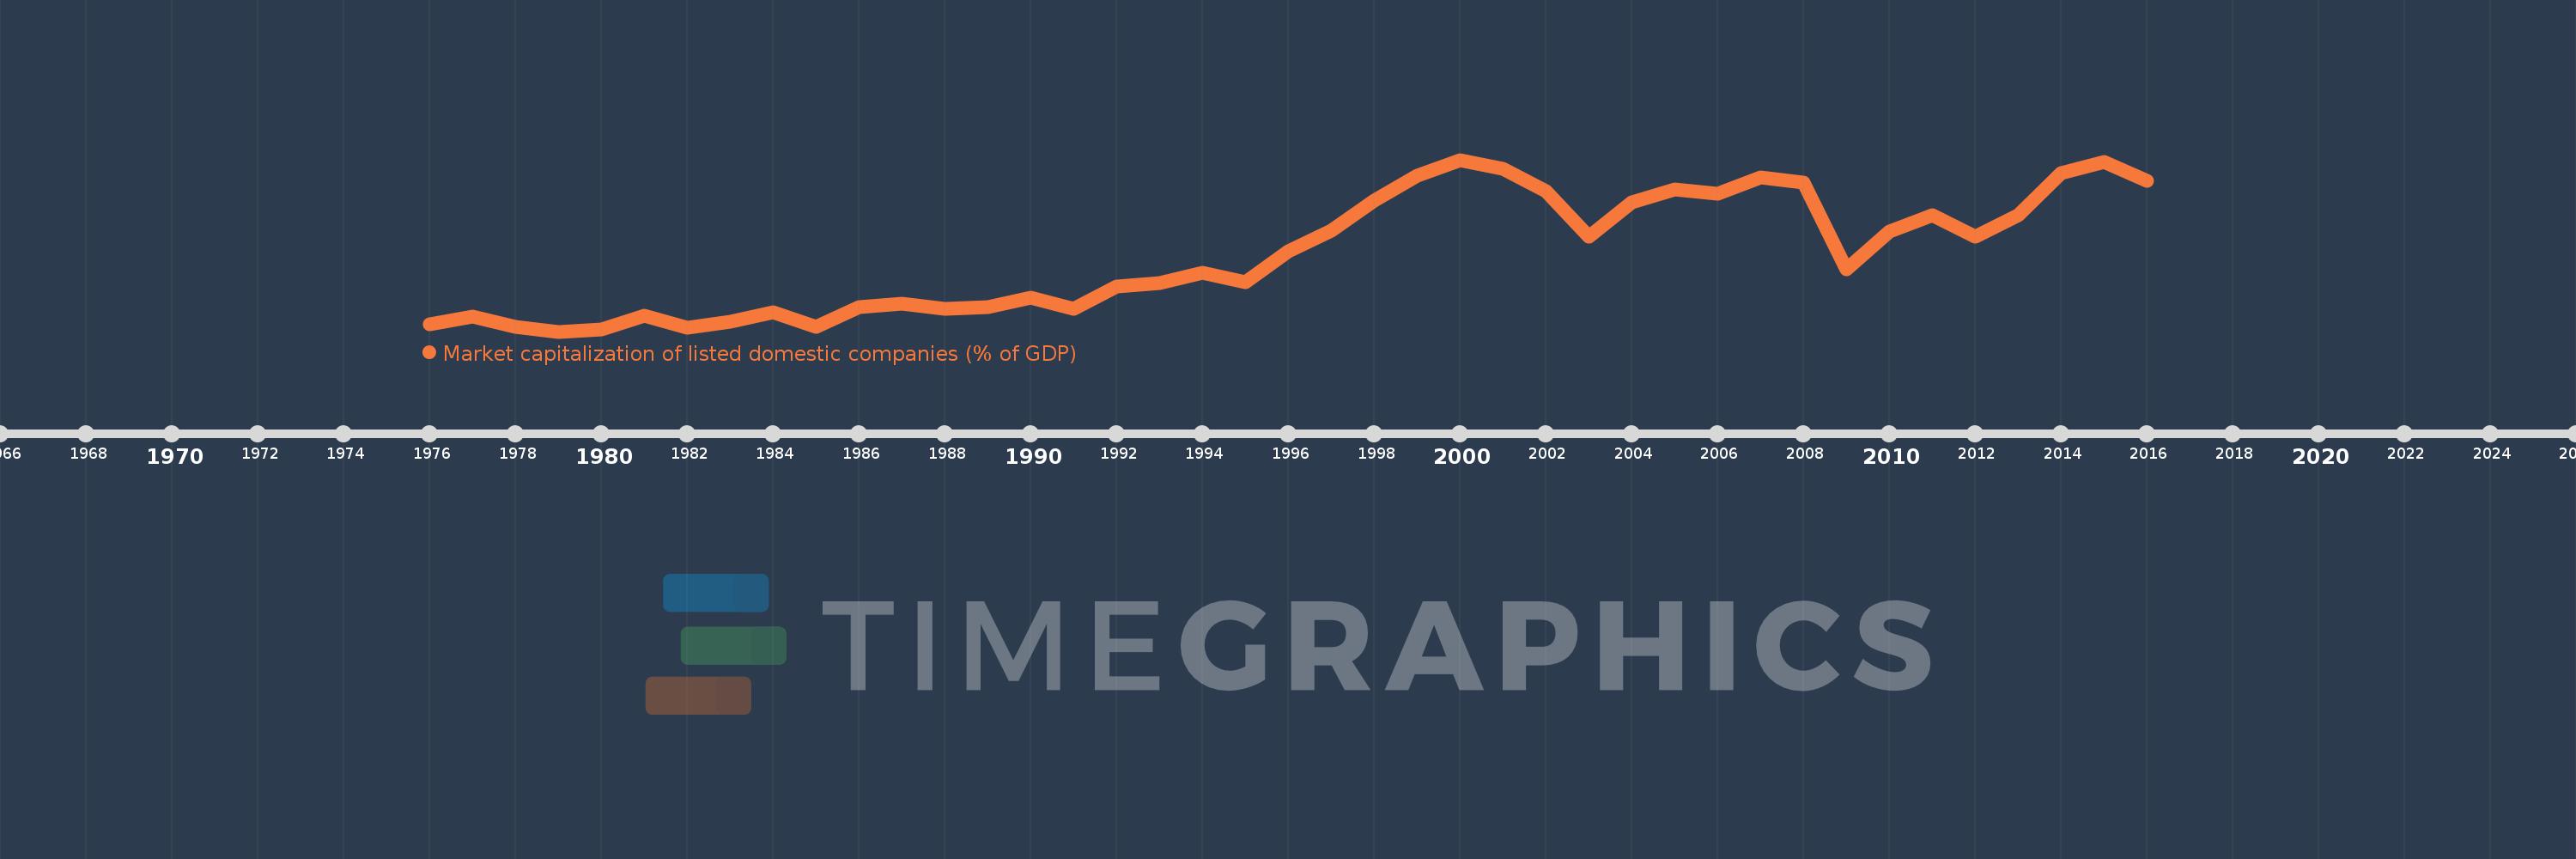
Market capitalization of listed domestic companies (% of GDP)
2016,2015,2014,2013,2012,2011,2010,2009,2008,2007,2006,2005,2004,2003,2002,2001,2000,1999,1998,1997,1996,1995,1994,1993,1992,1991,1990,1989,1988,1987,1986,1985,1984,1983,1982,1981,1980,1979,1978,1977,1976
This statistics in other country:
Timeline:
This timeline shows a graph from 1976 to 2016 of United States. No data until 1975. Number of actual observations by date: 41.
Source name:
World Development Indicators
Source organization:
World Federation of Exchanges database.
Categories, topics:
Financial Sector
Last updated:
apr 23, 2017
Indicators value changes by year
Minimum:
36.577
jan 1, 1979
Maximum:
152.965
jan 1, 2000
At the date of observation
Value
Absolute change
Change from previous value
jan 1, 1976
41.672
+41.672
0.0%
jan 1, 1977
47.034
+5.362
12.87%
jan 1, 1978
39.993
-7.041
-14.97%
jan 1, 1979
36.577
-3.416
-8.54%
jan 1, 1980
37.748
+1.171
3.2%
jan 1, 1981
47.504
+9.755
25.84%
jan 1, 1982
39.352
-8.152
-17.16%
jan 1, 1983
43.554
+4.202
10.68%
jan 1, 1984
49.724
+6.171
14.17%
jan 1, 1985
39.651
-10.074
-20.26%
jan 1, 1986
52.933
+13.282
33.5%
jan 1, 1987
55.291
+2.358
4.45%
jan 1, 1988
51.985
-3.306
-5.98%
jan 1, 1989
52.925
+0.94
1.81%
jan 1, 1990
59.781
+6.856
12.95%
jan 1, 1991
51.733
-8.048
-13.46%
jan 1, 1992
67.372
+15.639
30.23%
jan 1, 1993
69.516
+2.143
3.18%
jan 1, 1994
76.338
+6.822
9.81%
jan 1, 1995
70.296
-6.042
-7.92%
jan 1, 1996
90.709
+20.414
29.04%
jan 1, 1997
104.695
+13.985
15.42%
jan 1, 1998
125.11
+20.415
19.5%
jan 1, 1999
142.176
+17.065
13.64%
jan 1, 2000
152.965
+10.79
7.59%
jan 1, 2001
146.894
-6.071
-3.97%
jan 1, 2002
131.65
-15.244
-10.38%
jan 1, 2003
100.701
-30.95
-23.51%
jan 1, 2004
123.939
+23.239
23.08%
jan 1, 2005
132.984
+9.045
7.3%
jan 1, 2006
129.84
-3.145
-2.36%
jan 1, 2007
141.232
+11.392
8.77%
jan 1, 2008
137.607
-3.625
-2.57%
jan 1, 2009
78.746
-58.861
-42.77%
jan 1, 2010
104.567
+25.821
32.79%
jan 1, 2011
115.497
+10.93
10.45%
jan 1, 2012
100.791
-14.706
-12.73%
jan 1, 2013
115.556
+14.765
14.65%
jan 1, 2014
143.994
+28.439
24.61%
jan 1, 2015
151.385
+7.391
5.13%
jan 1, 2016
138.981
-12.404
-8.19%
Ranking of countries by current statistics by years


Comments: