29
/
en
AIzaSyAYiBZKx7MnpbEhh9jyipgxe19OcubqV5w
April 1, 2024
107528
Colombia
COL
true
2
1
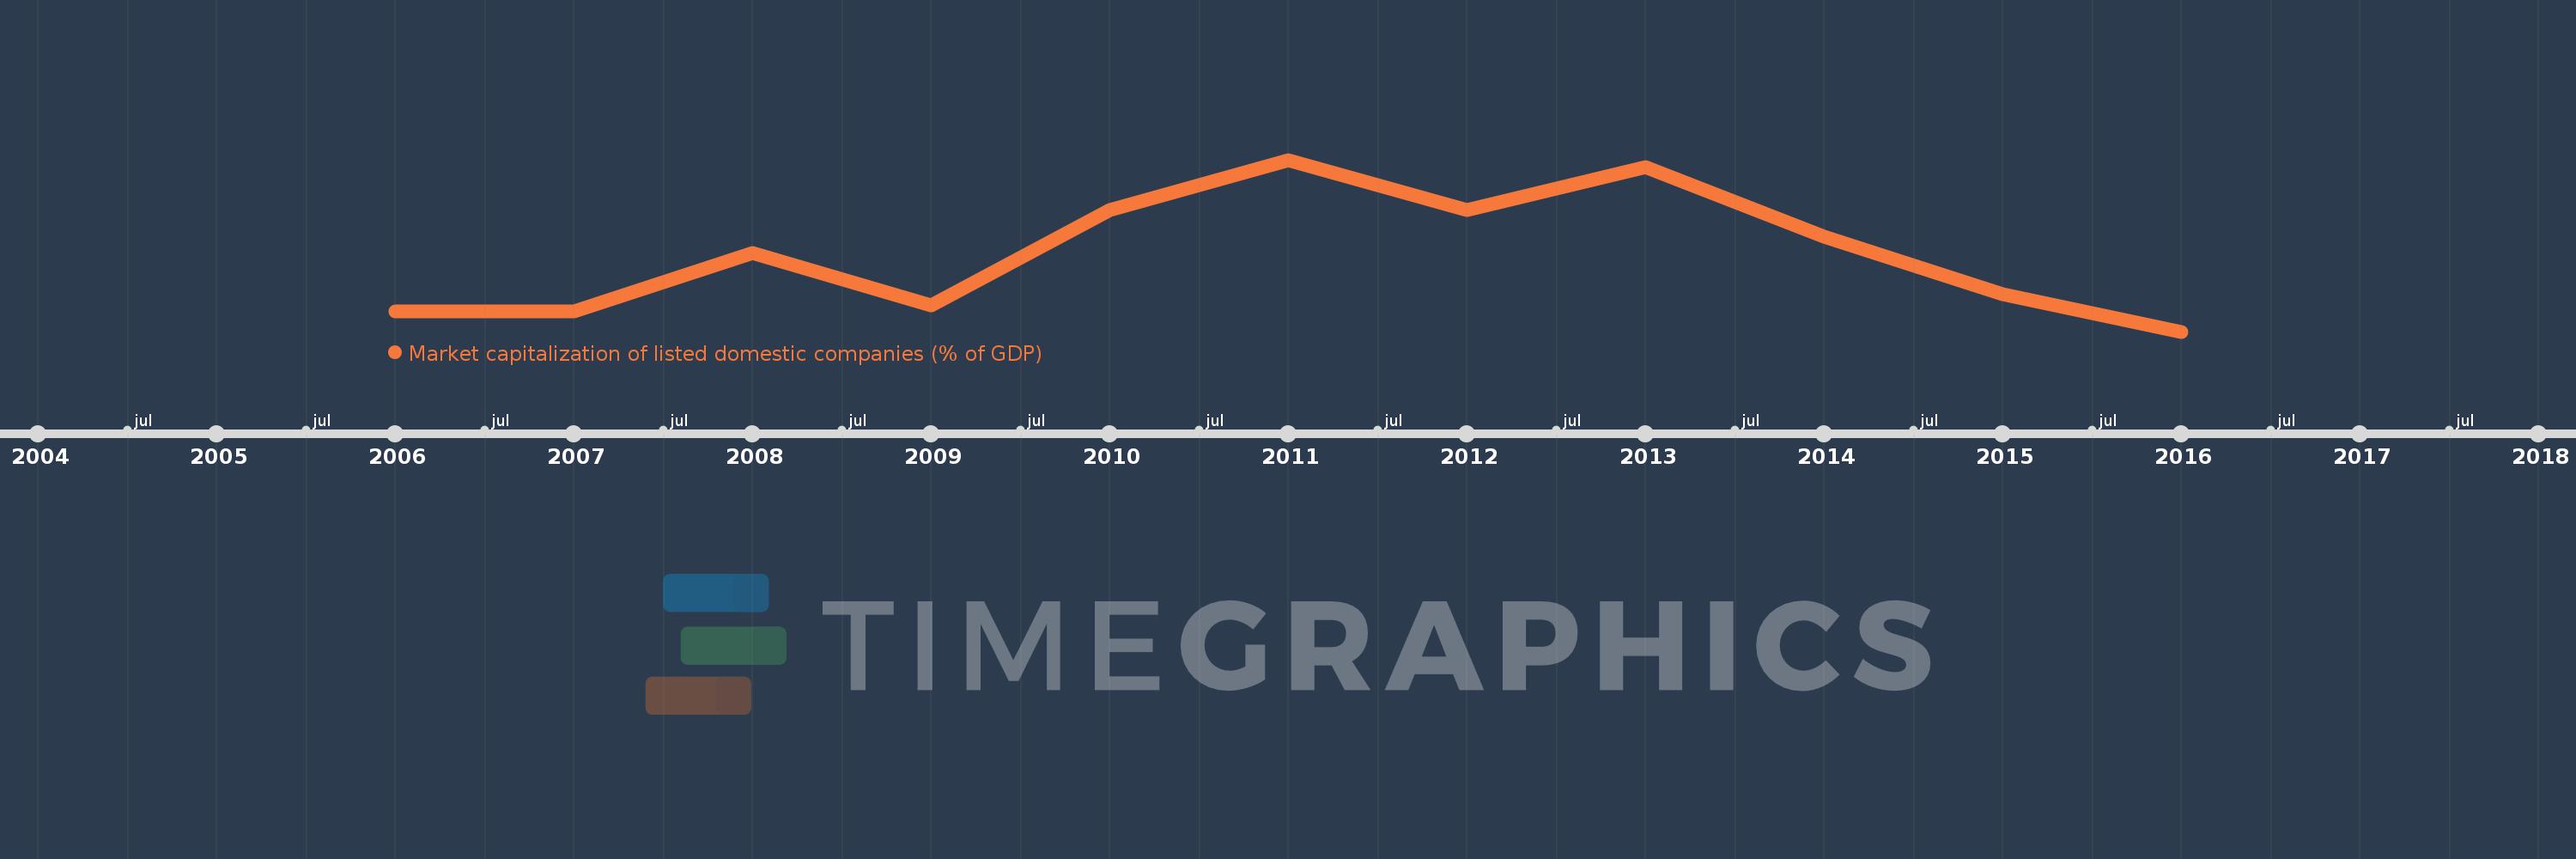
Market capitalization of listed domestic companies (% of GDP)
2016,2015,2014,2013,2012,2011,2010,2009,2008,2007,2006
This statistics in other country:
Timeline:
This timeline shows a graph from 2006 to 2016 of Colombia. No data until 2005. Number of actual observations by date: 11.
Source name:
World Development Indicators
Source organization:
World Federation of Exchanges database.
Categories, topics:
Financial Sector
Last updated:
apr 23, 2017
Indicators value changes by year
Minimum:
29.429
jan 1, 2016
Maximum:
72.644
jan 1, 2011
At the date of observation
Value
Absolute change
Change from previous value
jan 1, 2006
34.456
+34.456
0.0%
jan 1, 2007
34.568
+0.112
0.33%
jan 1, 2008
49.155
+14.587
42.2%
jan 1, 2009
35.952
-13.203
-26.86%
jan 1, 2010
60.097
+24.145
67.16%
jan 1, 2011
72.644
+12.547
20.88%
jan 1, 2012
60.014
-12.63
-17.39%
jan 1, 2013
70.903
+10.89
18.15%
jan 1, 2014
53.313
-17.59
-24.81%
jan 1, 2015
38.779
-14.534
-27.26%
jan 1, 2016
29.429
-9.35
-24.11%
Ranking of countries by current statistics by years


Comments: