29
/
en
AIzaSyAYiBZKx7MnpbEhh9jyipgxe19OcubqV5w
April 1, 2024
70086
Argentina
ARG
true
2
1
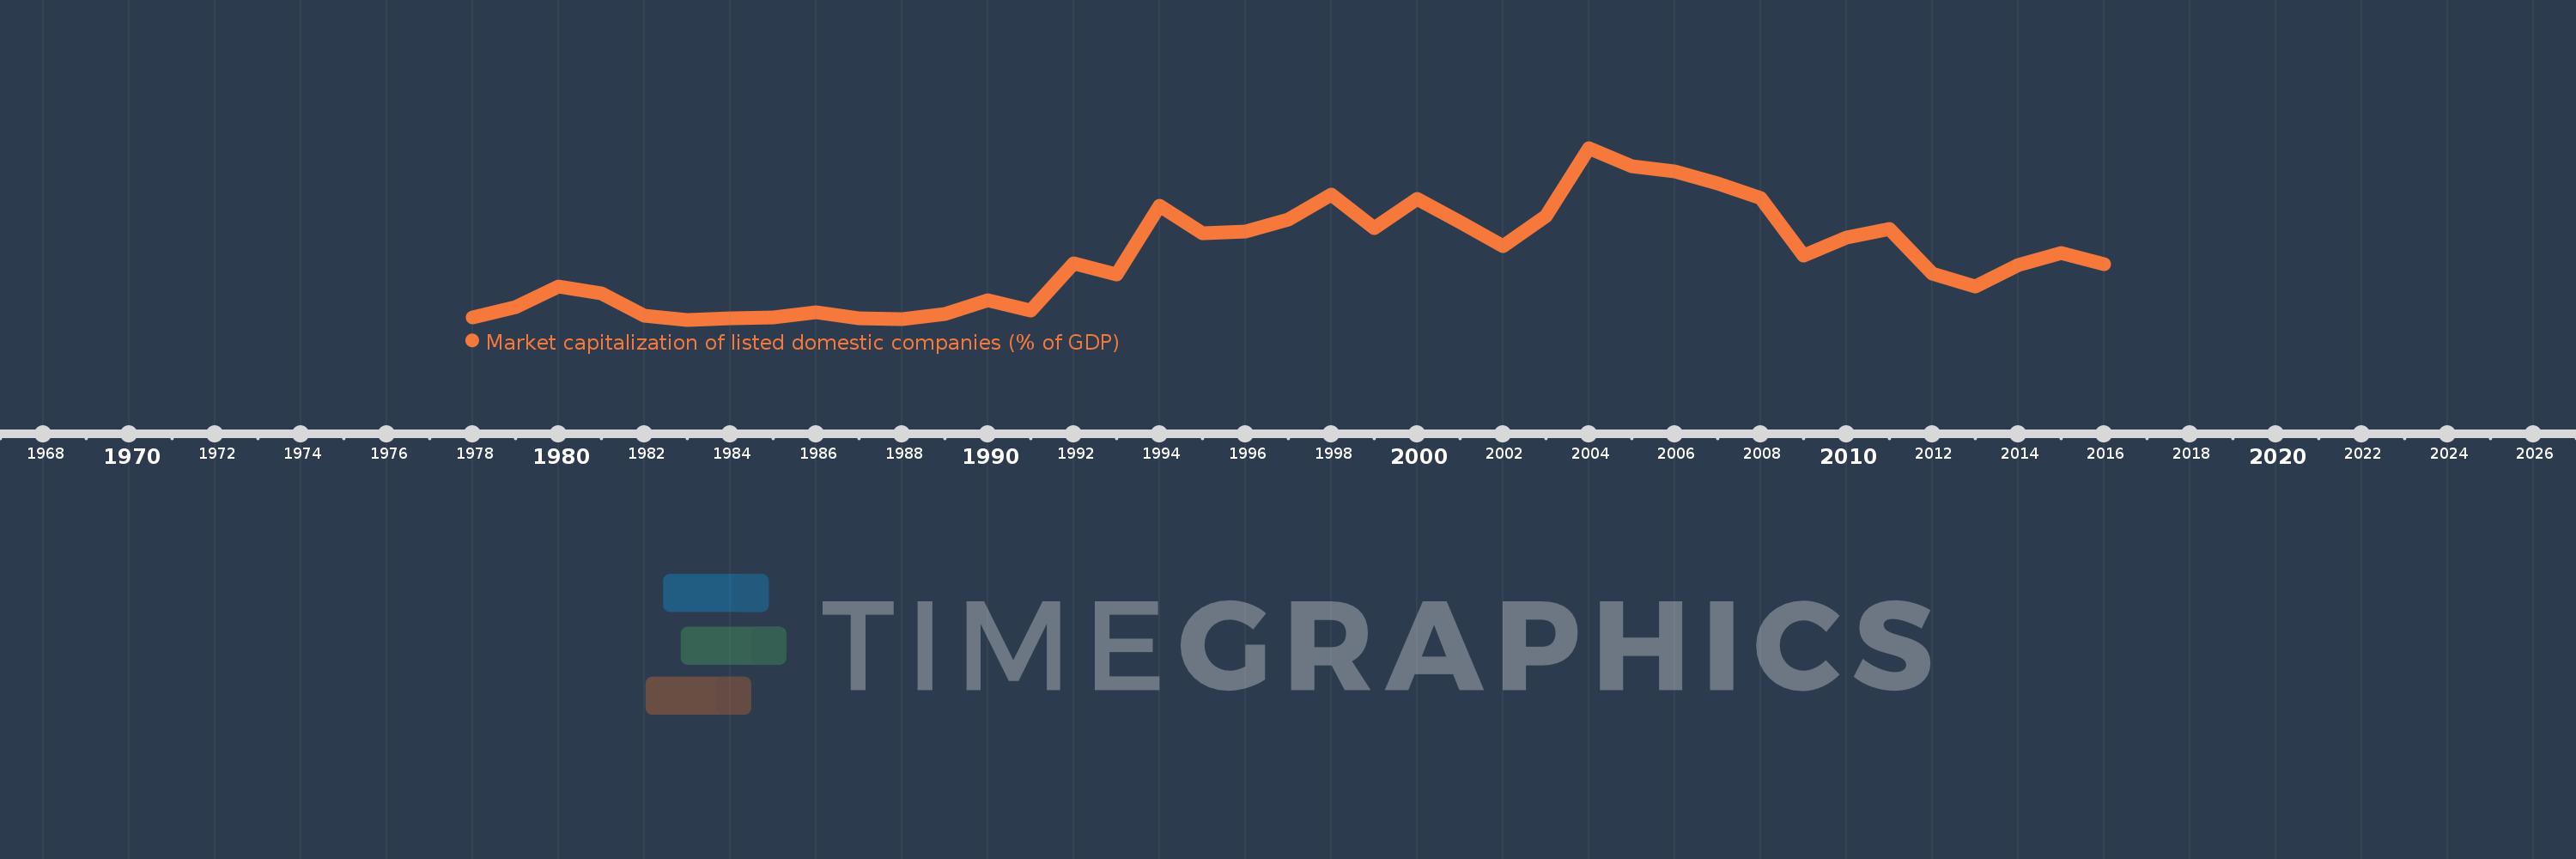
Market capitalization of listed domestic companies (% of GDP)
2016,2015,2014,2013,2012,2011,2010,2009,2008,2007,2006,2005,2004,2003,2002,2001,2000,1999,1998,1997,1996,1995,1994,1993,1992,1991,1990,1989,1988,1987,1986,1985,1984,1983,1982,1981,1980,1979,1978
This statistics in other country:
Timeline:
This timeline shows a graph from 1978 to 2016 of Argentina. No data until 1977. Number of actual observations by date: 39.
Source name:
World Development Indicators
Source organization:
World Federation of Exchanges database.
Categories, topics:
Financial Sector
Last updated:
apr 23, 2017
Indicators value changes by year
Maximum:
27.428
jan 1, 2004
At the date of observation
Value
Absolute change
Change from previous value
jan 1, 1978
1.466
+1.466
0.0%
jan 1, 1979
3.091
+1.625
110.83%
jan 1, 1980
6.238
+3.147
101.8%
jan 1, 1981
5.139
-1.099
-17.62%
jan 1, 1982
1.775
-3.364
-65.47%
jan 1, 1983
1.154
-0.621
-34.97%
jan 1, 1984
1.333
+0.179
15.53%
jan 1, 1985
1.48
+0.147
11.02%
jan 1, 1986
2.303
+0.822
55.56%
jan 1, 1987
1.434
-0.868
-37.72%
jan 1, 1988
1.276
-0.158
-11.0%
jan 1, 1989
2.023
+0.746
58.46%
jan 1, 1990
4.173
+2.15
106.32%
jan 1, 1991
2.558
-1.615
-38.71%
jan 1, 1992
9.825
+7.267
284.14%
jan 1, 1993
8.14
-1.685
-17.15%
jan 1, 1994
18.609
+10.469
128.62%
jan 1, 1995
14.321
-4.288
-23.04%
jan 1, 1996
14.643
+0.322
2.25%
jan 1, 1997
16.422
+1.779
12.15%
jan 1, 1998
20.232
+3.81
23.2%
jan 1, 1999
15.164
-5.068
-25.05%
jan 1, 2000
19.698
+4.534
29.9%
jan 1, 2001
16.129
-3.569
-18.12%
jan 1, 2002
12.424
-3.705
-22.97%
jan 1, 2003
16.957
+4.533
36.48%
jan 1, 2004
27.428
+10.471
61.75%
jan 1, 2005
24.653
-2.775
-10.12%
jan 1, 2006
23.855
-0.798
-3.24%
jan 1, 2007
21.937
-1.919
-8.04%
jan 1, 2008
19.759
-2.178
-9.93%
jan 1, 2009
10.974
-8.785
-44.46%
jan 1, 2010
13.676
+2.702
24.62%
jan 1, 2011
15.005
+1.329
9.72%
jan 1, 2012
8.173
-6.832
-45.53%
jan 1, 2013
6.24
-1.933
-23.65%
jan 1, 2014
9.583
+3.343
53.57%
jan 1, 2015
11.353
+1.77
18.47%
jan 1, 2016
9.626
-1.728
-15.22%
Ranking of countries by current statistics by years


Comments: