29
/
en
AIzaSyAYiBZKx7MnpbEhh9jyipgxe19OcubqV5w
April 1, 2024
119146
Denmark
DNK
true
2
1
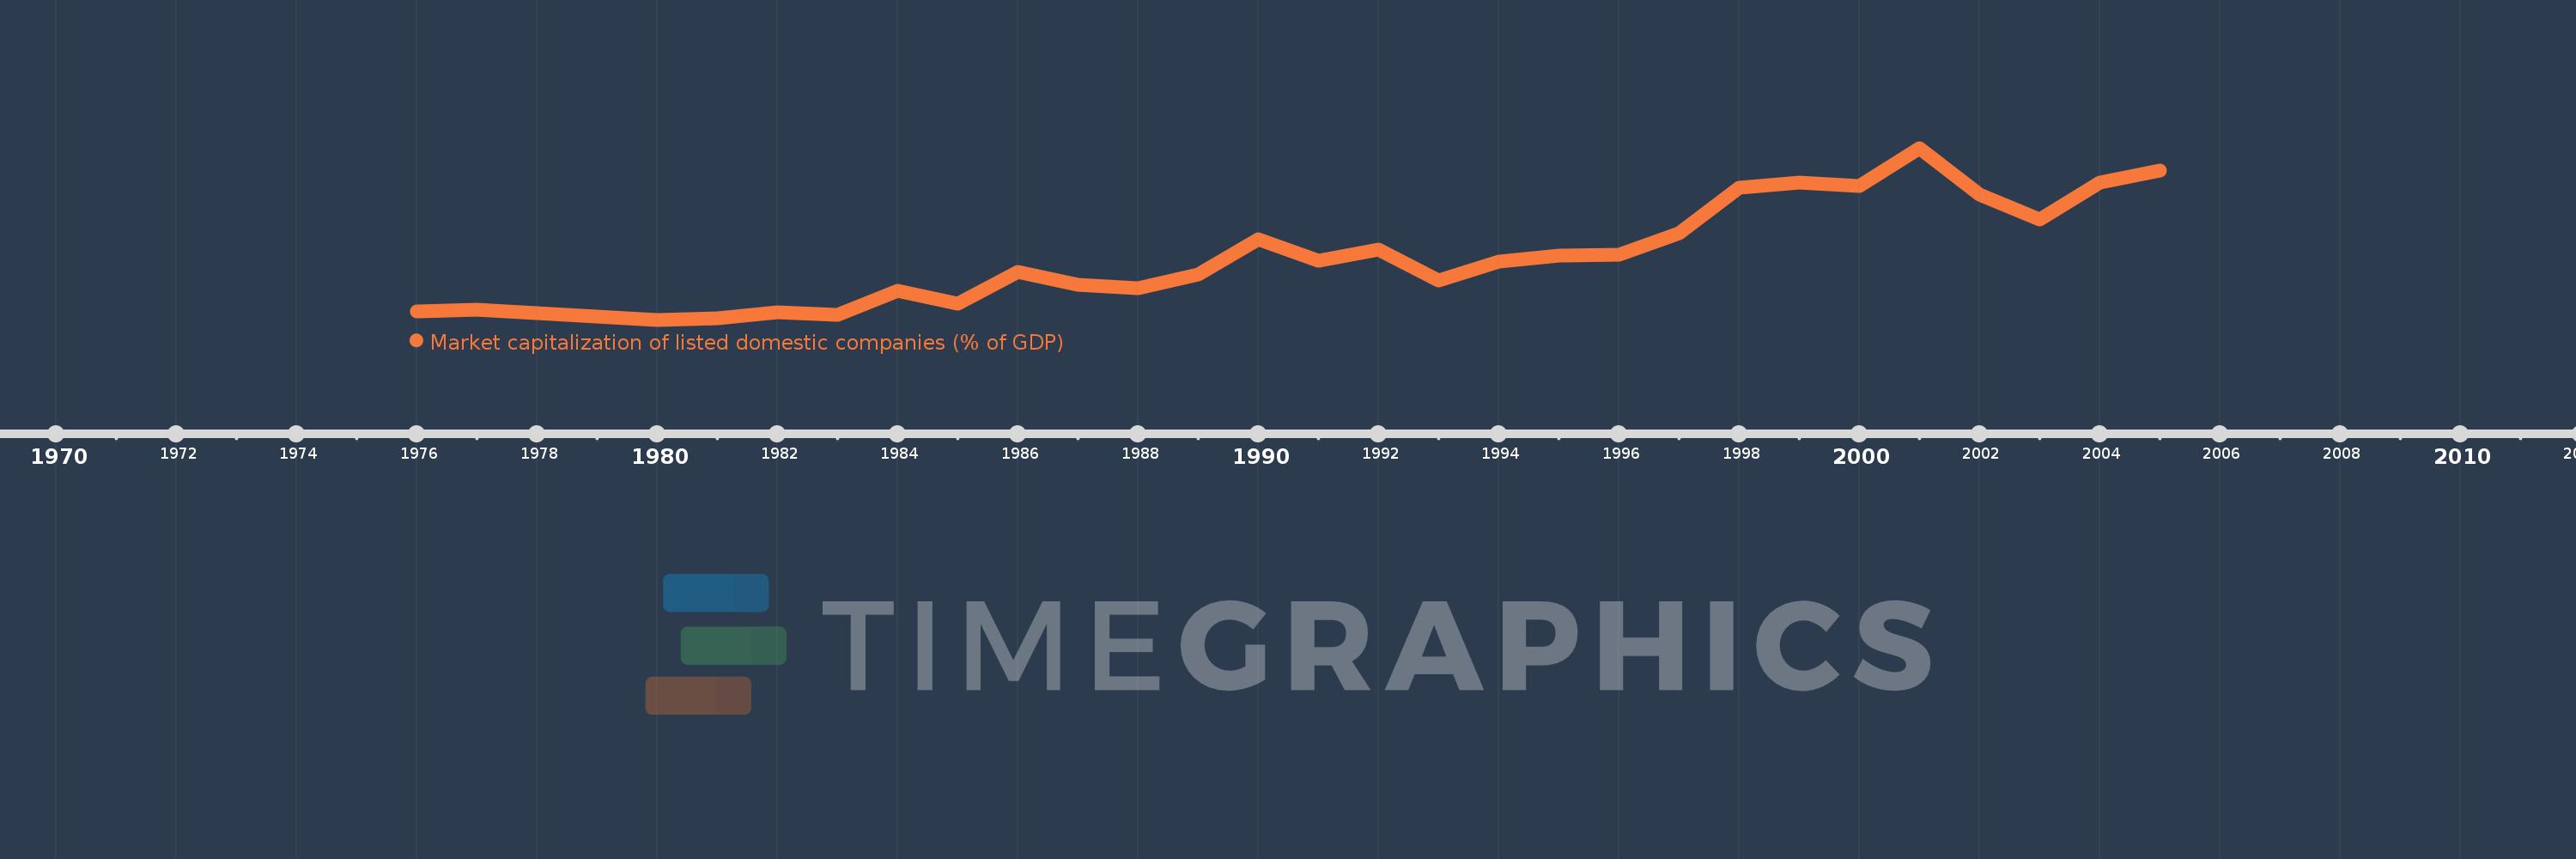
Market capitalization of listed domestic companies (% of GDP)
2005,2004,2003,2002,2001,2000,1999,1998,1997,1996,1995,1994,1993,1992,1991,1990,1989,1988,1987,1986,1985,1984,1983,1982,1981,1980,1979,1978,1977,1976
This statistics in other country:
Timeline:
This timeline shows a graph from 1976 to 2005 of Denmark. No data until 1975. Number of actual observations by date: 30.
Source name:
World Development Indicators
Source organization:
World Federation of Exchanges database.
Categories, topics:
Financial Sector
Last updated:
apr 23, 2017
Indicators value changes by year
Maximum:
68.116
jan 1, 2001
At the date of observation
Value
Absolute change
Change from previous value
jan 1, 1976
10.186
+10.186
0.0%
jan 1, 1977
10.81
+0.624
6.13%
jan 1, 1978
9.624
-1.186
-10.97%
jan 1, 1979
8.518
-1.107
-11.5%
jan 1, 1980
7.381
-1.136
-13.34%
jan 1, 1981
7.822
+0.441
5.97%
jan 1, 1982
10.057
+2.235
28.57%
jan 1, 1983
9.255
-0.802
-7.97%
jan 1, 1984
17.54
+8.285
89.52%
jan 1, 1985
12.933
-4.607
-26.27%
jan 1, 1986
24.263
+11.33
87.61%
jan 1, 1987
19.774
-4.488
-18.5%
jan 1, 1988
18.635
-1.139
-5.76%
jan 1, 1989
23.355
+4.719
25.33%
jan 1, 1990
35.951
+12.596
53.93%
jan 1, 1991
28.287
-7.664
-21.32%
jan 1, 1992
32.233
+3.946
13.95%
jan 1, 1993
21.277
-10.956
-33.99%
jan 1, 1994
27.933
+6.655
31.28%
jan 1, 1995
30.102
+2.17
7.77%
jan 1, 1996
30.389
+0.287
0.95%
jan 1, 1997
37.882
+7.493
24.66%
jan 1, 1998
54.036
+16.154
42.64%
jan 1, 1999
55.864
+1.828
3.38%
jan 1, 2000
54.759
-1.105
-1.98%
jan 1, 2001
68.116
+13.357
24.39%
jan 1, 2002
51.669
-16.447
-24.15%
jan 1, 2003
42.965
-8.704
-16.85%
jan 1, 2004
55.774
+12.809
29.81%
jan 1, 2005
60.24
+4.466
8.01%
Ranking of countries by current statistics by years


Comments: