29
/
en
AIzaSyAYiBZKx7MnpbEhh9jyipgxe19OcubqV5w
April 1, 2024
281255
Venezuela, RB
VEN
true
2
1
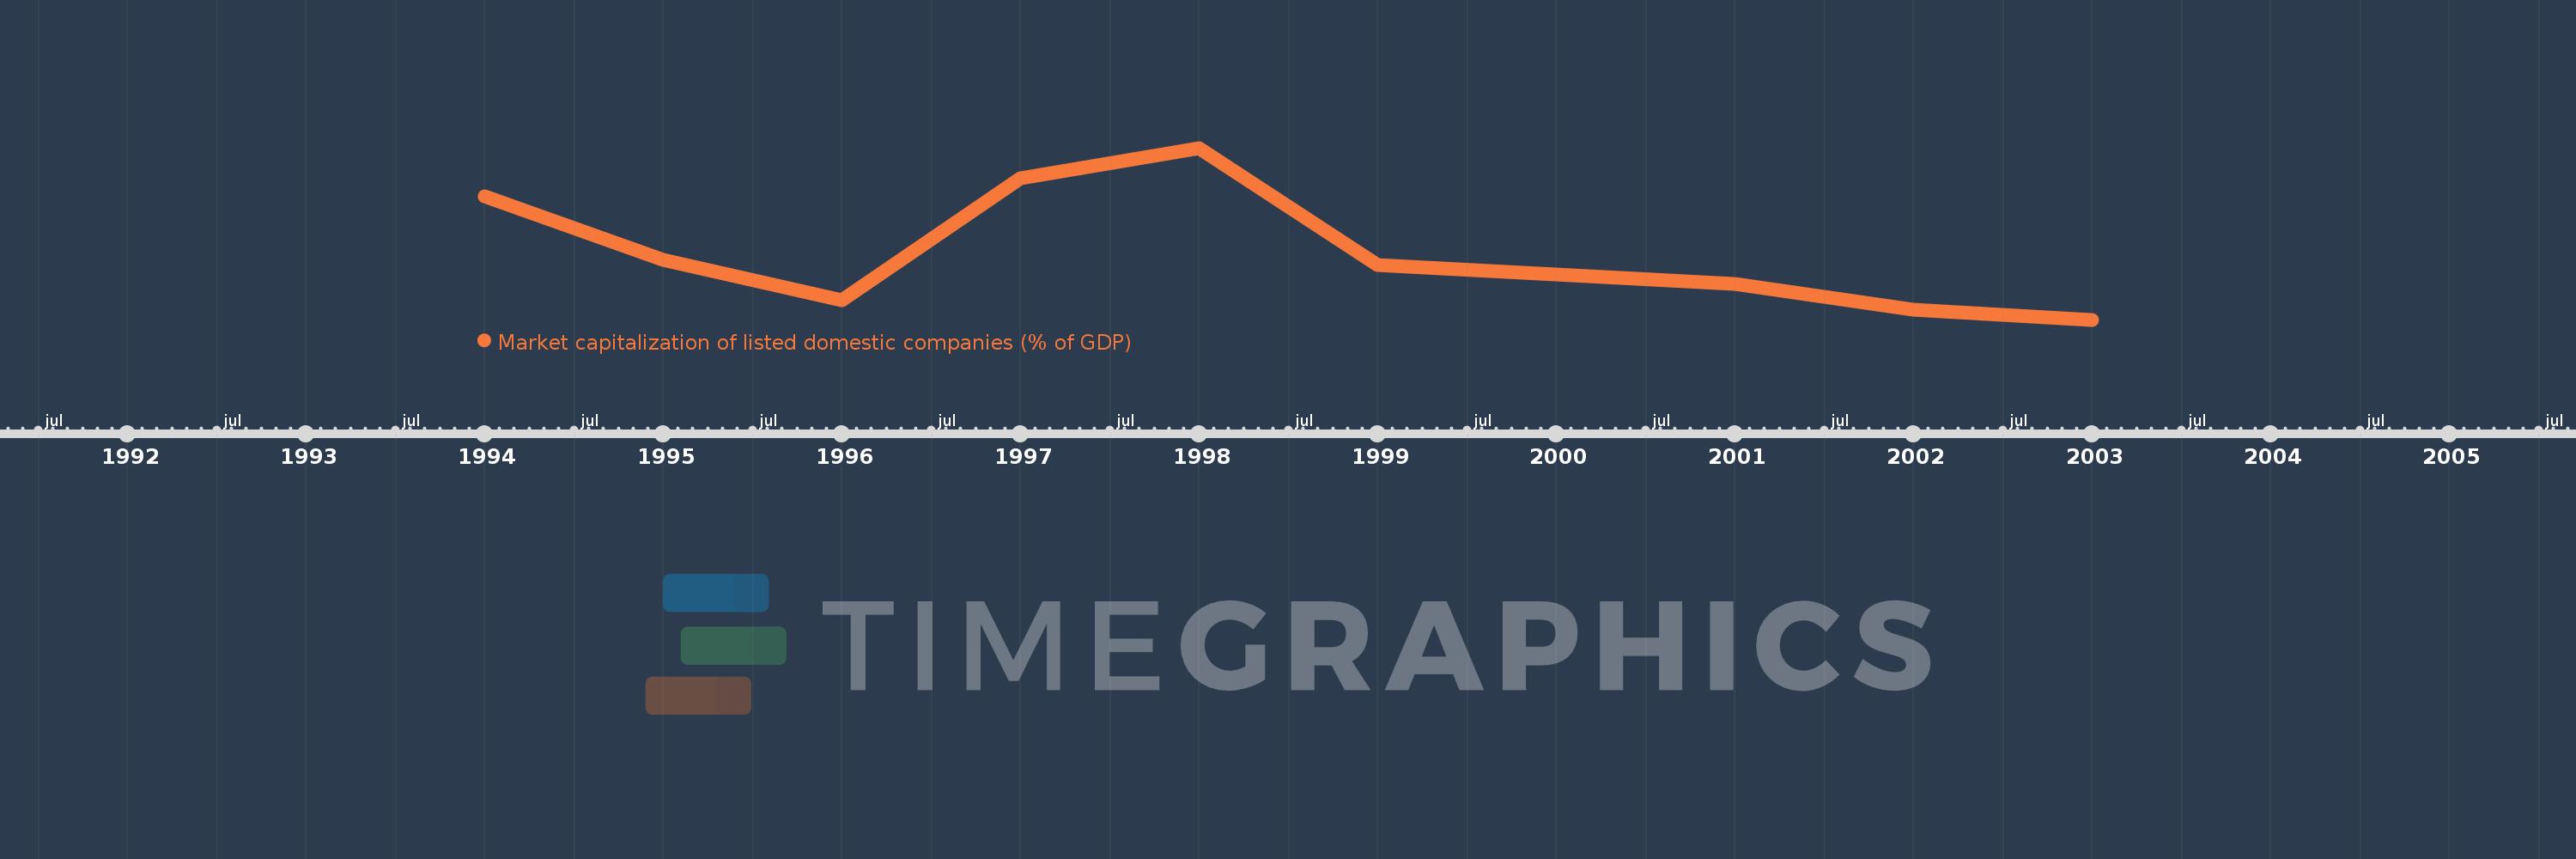
Market capitalization of listed domestic companies (% of GDP)
2003,2002,2001,2000,1999,1998,1997,1996,1995,1994
This statistics in other country:
Timeline:
This timeline shows a graph from 1994 to 2003 of Venezuela, RB. No data until 1993. Number of actual observations by date: 10.
Source name:
World Development Indicators
Source organization:
World Federation of Exchanges database.
Categories, topics:
Financial Sector
Last updated:
apr 23, 2017
Indicators value changes by year
Maximum:
16.985
jan 1, 1998
At the date of observation
Value
Absolute change
Change from previous value
jan 1, 1994
13.421
+13.421
0.0%
jan 1, 1995
8.717
-4.704
-35.05%
jan 1, 1996
5.721
-2.997
-34.38%
jan 1, 1997
14.742
+9.021
157.7%
jan 1, 1998
16.985
+2.243
15.22%
jan 1, 1999
8.3
-8.685
-51.13%
jan 1, 2000
7.608
-0.692
-8.34%
jan 1, 2001
6.915
-0.693
-9.11%
jan 1, 2002
5.057
-1.857
-26.86%
jan 1, 2003
4.284
-0.773
-15.29%
Ranking of countries by current statistics by years


Comments: