29
/
en
AIzaSyAYiBZKx7MnpbEhh9jyipgxe19OcubqV5w
April 1, 2024
41653
Latin America & Caribbean
LCN
false
2
1
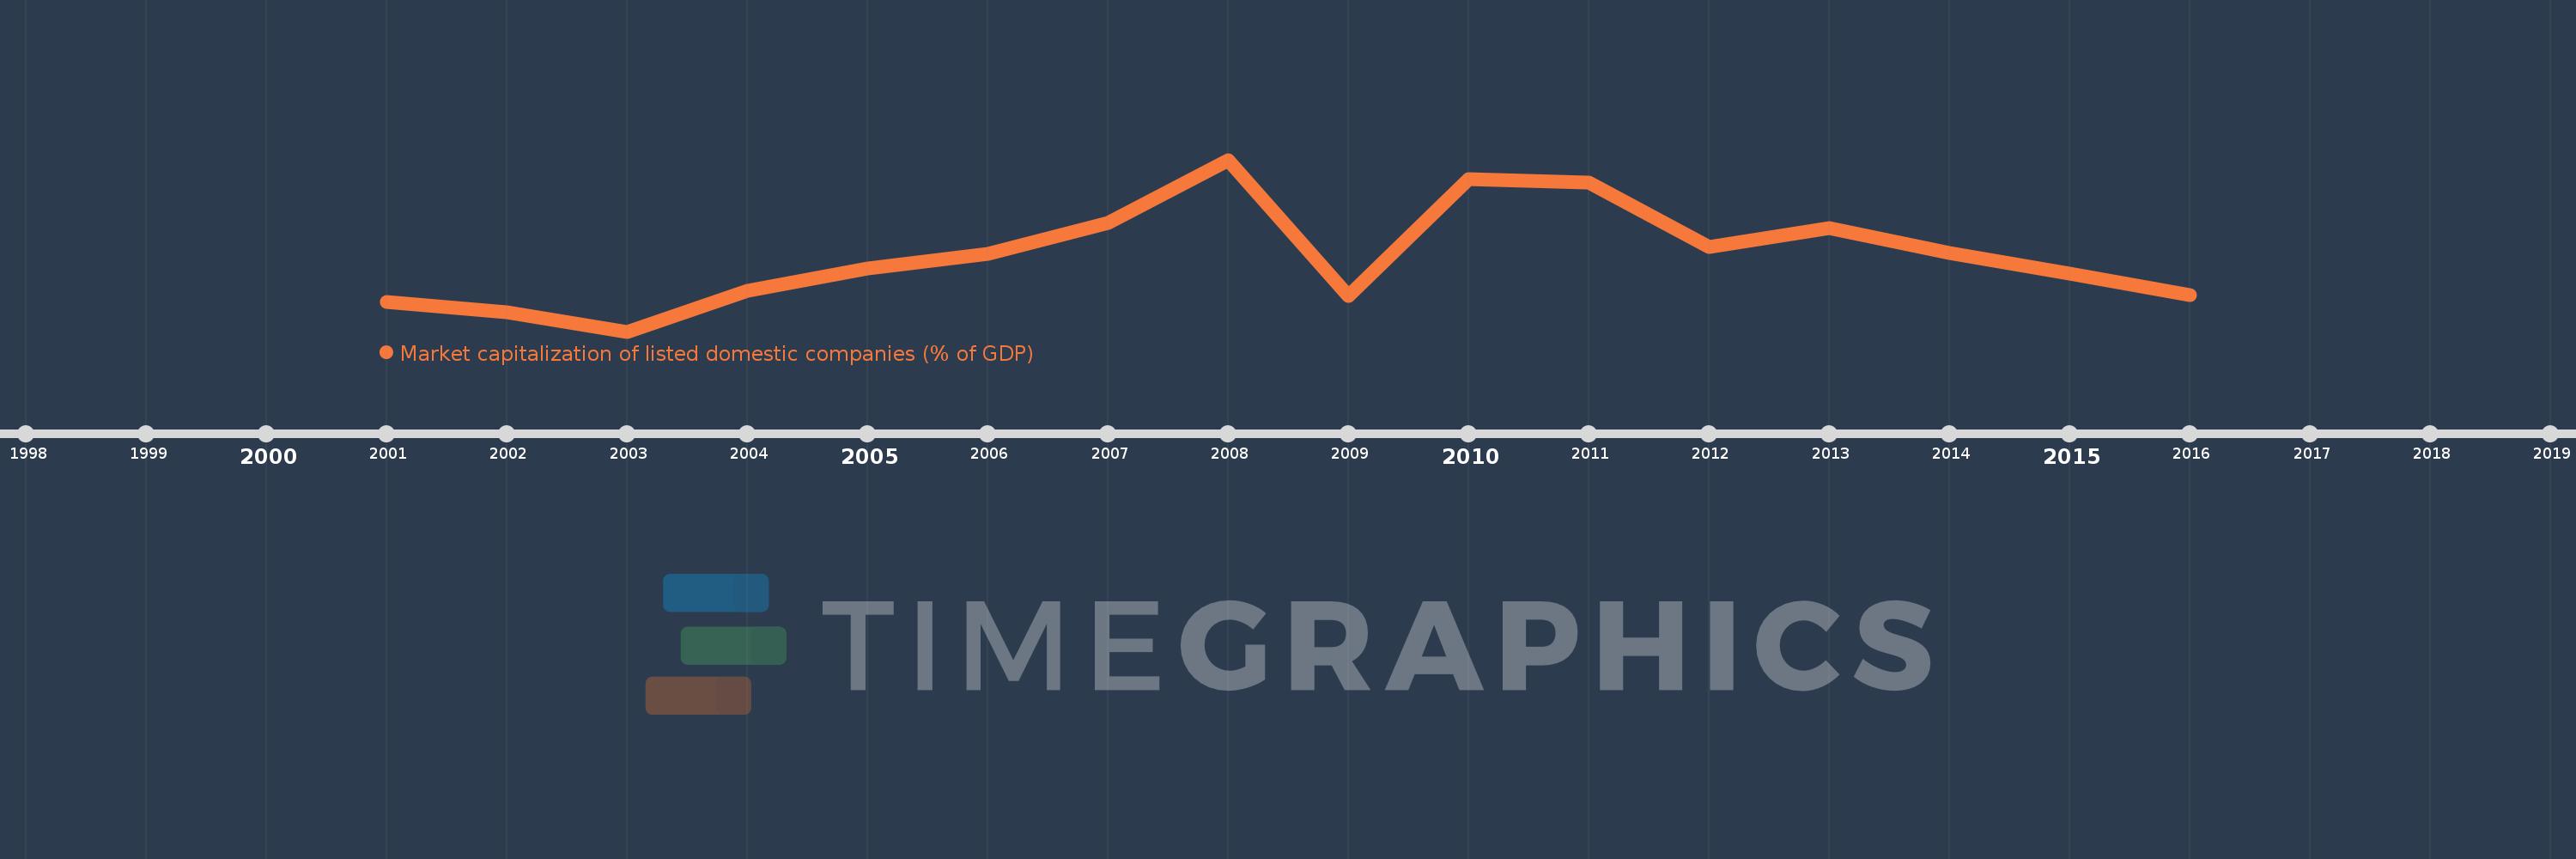
Market capitalization of listed domestic companies (% of GDP)
2016,2015,2014,2013,2012,2011,2010,2009,2008,2007,2006,2005,2004,2003,2002,2001
This statistics in other country:
Timeline:
This timeline shows a graph from 2001 to 2016 of Latin America & Caribbean . No data until 2000. Number of actual observations by date: 16.
Source name:
World Development Indicators
Source organization:
World Federation of Exchanges database.
Categories, topics:
Financial Sector
Last updated:
apr 23, 2017
Indicators value changes by year
Minimum:
20.153
jan 1, 2003
Maximum:
67.605
jan 1, 2008
At the date of observation
Value
Absolute change
Change from previous value
jan 1, 2001
28.434
+28.434
0.0%
jan 1, 2002
25.488
-2.947
-10.36%
jan 1, 2003
20.153
-5.334
-20.93%
jan 1, 2004
31.44
+11.287
56.0%
jan 1, 2005
37.58
+6.14
19.53%
jan 1, 2006
41.635
+4.054
10.79%
jan 1, 2007
50.13
+8.495
20.4%
jan 1, 2008
67.605
+17.475
34.86%
jan 1, 2009
30.01
-37.595
-55.61%
jan 1, 2010
62.349
+32.34
107.76%
jan 1, 2011
61.398
-0.952
-1.53%
jan 1, 2012
43.407
-17.991
-29.3%
jan 1, 2013
48.855
+5.448
12.55%
jan 1, 2014
41.795
-7.06
-14.45%
jan 1, 2015
36.259
-5.535
-13.24%
jan 1, 2016
30.348
-5.912
-16.3%
Ranking of countries by current statistics by years


Comments: