29
/
en
AIzaSyAYiBZKx7MnpbEhh9jyipgxe19OcubqV5w
April 1, 2024
25889
Central Europe and the Baltics
CEB
false
2
1
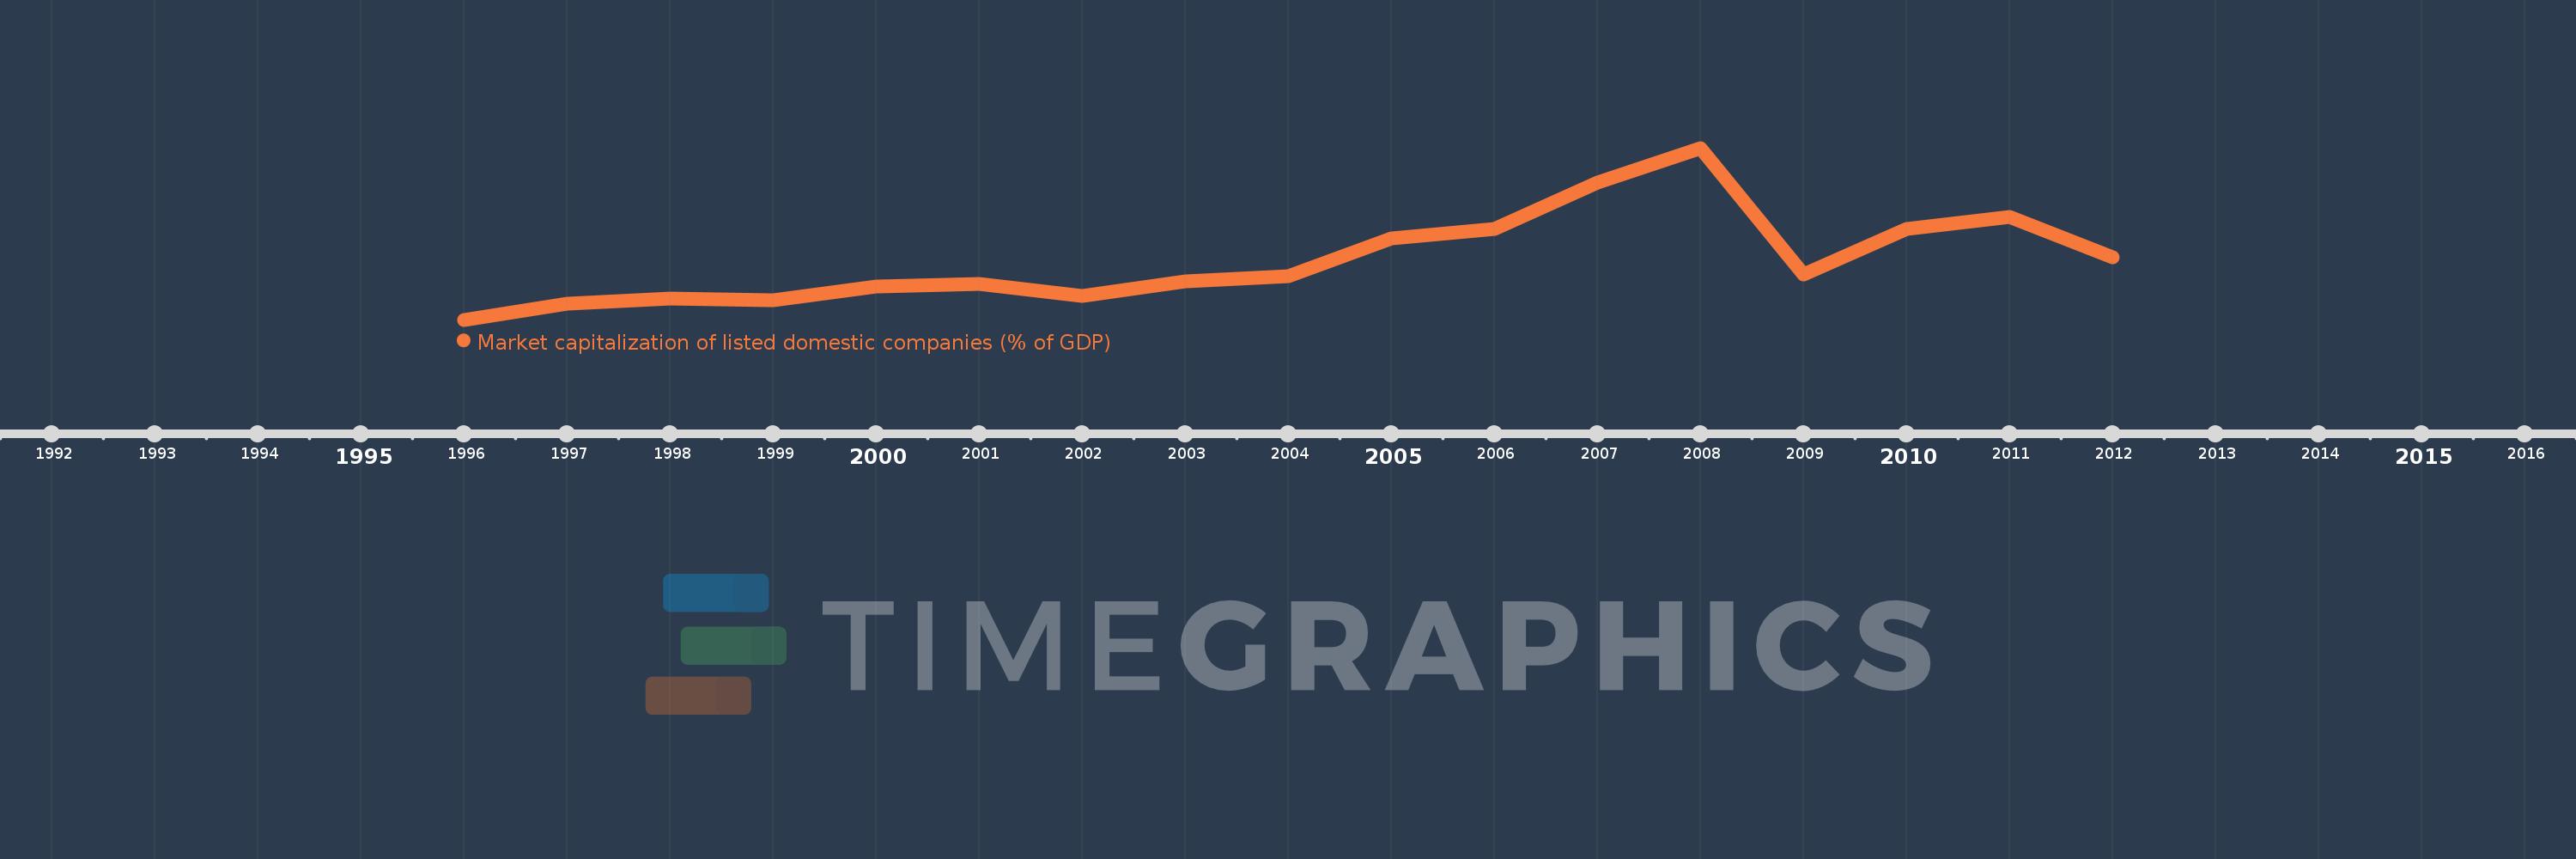
Market capitalization of listed domestic companies (% of GDP)
2012,2011,2010,2009,2008,2007,2006,2005,2004,2003,2002,2001,2000,1999,1998,1997,1996
This statistics in other country:
Timeline:
This timeline shows a graph from 1996 to 2012 of Central Europe and the Baltics. No data until 1995. Number of actual observations by date: 17.
Source name:
World Development Indicators
Source organization:
World Federation of Exchanges database.
Categories, topics:
Financial Sector
Last updated:
apr 23, 2017
Indicators value changes by year
Maximum:
41.524
jan 1, 2008
At the date of observation
Value
Absolute change
Change from previous value
jan 1, 1996
6.05
+6.05
0.0%
jan 1, 1997
9.302
+3.252
53.75%
jan 1, 1998
10.383
+1.082
11.63%
jan 1, 1999
10.128
-0.255
-2.45%
jan 1, 2000
12.867
+2.738
27.04%
jan 1, 2001
13.458
+0.591
4.59%
jan 1, 2002
10.96
-2.497
-18.56%
jan 1, 2003
14.002
+3.042
27.75%
jan 1, 2004
14.969
+0.967
6.91%
jan 1, 2005
22.826
+7.856
52.48%
jan 1, 2006
24.823
+1.997
8.75%
jan 1, 2007
34.365
+9.542
38.44%
jan 1, 2008
41.524
+7.159
20.83%
jan 1, 2009
15.438
-26.086
-62.82%
jan 1, 2010
24.885
+9.447
61.2%
jan 1, 2011
27.227
+2.342
9.41%
jan 1, 2012
19.014
-8.213
-30.16%
Ranking of countries by current statistics by years


Comments: